Download
1 / 26
260 likes | 380 Vues
Update on Bicyclist & Pedestrian Data Collection and Modeling Efforts. Transportation Research Board January 2010 Charlie Denney, Associate Michael Jones, Principal. Four concurrent efforts. #1: Seamless Travel: 2.5 year study of San Diego County

E N D
Update on Bicyclist & Pedestrian Data Collection and Modeling Efforts Transportation Research Board January 2010 Charlie Denney, Associate Michael Jones, Principal
Four concurrent efforts • #1: Seamless Travel: 2.5 year study of San Diego County • For Caltrans with UC Berkeley Traffic Safety Center
Four concurrent efforts • #2: National Bicycle & Pedestrian Documentation Project • Free, unfunded service • With ITE, Texas Transportation Institute, and others since 2002
Four concurrent efforts • #3: Non-motorized Transportation Pilot Project • With Volpe National Transportation Systems Center since 2006 • #4: Trip generation study with ITE: initiated in 2009
Collected and Analyzed to Date • NBPD count/survey data from 320+ agencies nationwide • NHTS add-on for San Diego County (2010) • Count/survey data at over 150 locations for 4 NTPP communities + mail travel diary surveys • 365-day/yr 24 hr counts for 2 years at 5 locations • Manual counts/intercept surveys at 80 locations over 2 years
Result • Largest collection of usable count and intercept survey data in the U.S. • Count data = validation = model accuracy
Key Seamless Findings • 76% of walk and 29% of bicycle trips are for transportation (v. recreation) = • Integral parts of transportation system • Deserve more funding
Key Seamless Findings • Multi use pathways carry the most transportation trips = • Should be funded as transportation projects
Key Seamless Findings • Multi use pathway free flow capacity is 120 persons per hour per foot of width = • Pathway design should be based on projected volumes
Key Seamless Findings • Multi use pathway ‘design day’ is July 4th, 11am-1pm = • Conduct counts on this date
Key Seamless Findings • Given seasonal & regional variations, annual volumes should be standard unit of measurement = • Versus ADT, peak hour, etc.
Key Seamless Findings • Low volumes = high variability • High volumes = low variability = • Conduct multiple counts at low volume locations for model validation
Key Seamless Findings • Monthly volumes highly related to regional variations = • Automatic counters needed in each region of the country to calibrate models
How can we model behavior? • Four types of models needed • Each with different data needs and uses
Model #1 • Aggregate Model • Measures overall trip making in an area • Used in Non-motorized Transportation Pilot Project • Cross checked with NHTS & U of Minnesota Surveys
NBPD Aggregate Model Work CommuteEmployed adults riding bicycles/walking (US Census) School CommuteSchool children riding bicycles/walking (US Census and available sources) College CommuteCollege students riding bicycles/walking (UC Census) Utilitarian TripsNon-work or school trips by bicycle/walking (surveys, other) Recreational/DiscretionaryRecreational/discretionary trips by bicycle/walking (surveys, studies) Total daily estimated bicycle and walking trips Average trip length, trip purpose Replaced vehicle miles, health, transportation, other benefits
Model #2 • Trip Generation • Measures trip making by land use • Will be used as part of impact analysis, localized models • Data being collected by ITE
Model #3 • Gravity Model • Measures volumes using 4-step process • Usable at bottlenecks and where there is a regular street grid, developed bike network, and level terrain
Can we use existing models? • Existing 4-step (gravity) travel models will not work for bicyclists and pedestrians for most areas
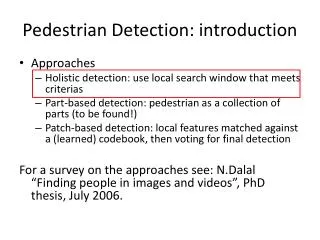
4-Step Models • Most trips within a TAZ • Most ped trips linked • Most factors affecting trip making can’t be modeled: • Topography • Abilities, interests, aesthetics • Concerns about security & traffic • Quality of facilities & network
How can we model behavior? • GIS-based (Seamless) Model • Estimates bicyclist and pedestrian volumes anywhere in a community • Can be used to develop collision rates, prioritize improvements, plan and design facilities and communities
GIS-based Seamless Model • 30+ variables correlated with counts • Highest = Employment density and population density • Misleading R2 factors. Over 50% of locations off by more than 100% • Refinement factors resulted in R2 of .94, with mean residuals of -21
Summary More information or to participate: Alta Planning + Design www.altaplanning.com mgjones@altaplanning.com Michael Jones (415) 482-8660