Download
1 / 22
220 likes | 372 Vues
climate change updated Corinne Le Qu éré Professor of Climate Change Science and Policy University of East Anglia. temperature measurements on land. http://www.cru.uea.ac.uk/cru/data/landstations/ Brohan et al. J. Geophys Res. (2006). temperature measurements in the sea.

E N D
climate change updated Corinne Le Quéré Professor of Climate Change Science and Policy University of East Anglia
temperature measurements on land http://www.cru.uea.ac.uk/cru/data/landstations/ Brohan et al. J. Geophys Res. (2006)
temperature measurements in the sea earthobservatory.nasa.gov Photo: Xiaojun Yuan LDEO.columbia.edu Kent et al. (2010) Wires of Climate Change
warming of global air temperature +0.4 temperature anomaly (°C) -0.4 1900 1950 2000 Time (y) data source: NASA-GISS, reference period 1951-1980
melting of glaciers and ice caps Qori Kalis, Peru 1978, 2002
melting of glaciers and ice caps Kilimanjaro 1993, 2000
melting of glaciers and ice caps Trift, Suisse 1948, 2002, 2006
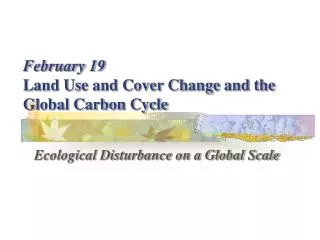
data source: Dyurgerov and Meier 2005, figure from Rober A. Rohde for the Global Warming Art project
melting of the Arctic sea ice Copenhagen Diagnosis 2009
Warming of the climate system is unequivocal temperature sea level Arctic Sept ice extent 1900 2000 Time (y) adapted from IPCC 2007, data from NASA GISS, NSIDC, Church and White, Colorado University
But is it caused by human activities? • yes! • we understand the processes • global warming has fingerprints John Tyndall’s laboratory setup 1859
Fingerprints for climate change: surface warming observed volcanoes & sun only IPCC 2007 Fig 9.5
Fingerprints for climate change: surface warming greenhouse gases, volcanoes & sun observed volcanoes & sun only IPCC 2007 Fig 9.5
But is it caused by human activities? • yes! • we understand the processes • global warming has fingerprints • it is above the background natural variability (caveat) Copenhagen Diagnosis 2009, from Mann et al. 2008
But is it caused by human activities? • yes! • we understand the processes • global warming has fingerprints • it is above the background natural variability (caveat) • there are no other reasonable explanations If it looks like a dog, and it barks like a dog, it is a dog.
So what’s next? (~4.5°C) my best guess (~3°C) today (~2.5°C) (~2°C)
So what’s next? (~4.5°C) year of your retirement year of my retirement (~3°C) today (~2.5°C) (~2°C)
http://www.metoffice.gov.uk/news/releases/archive/2009/mapping-climate-impactshttp://www.metoffice.gov.uk/news/releases/archive/2009/mapping-climate-impacts
melting of the ice (and other unknowns)
(billion) * world population time (y) projections: Lutz et al. IIASA 2007
(billion) * world population time (y) projections: Lutz et al. IIASA 2007
Oxford Street, London 1910 1890 1950 2012 http://www.art247.com/Tshirt/15568 http://www.virtual-london.com/oxford-circus-and-piccadilly-circus http://theedwardians.blogspot.co.uk/2011/05/view-down-oxford-street-london-c1890.html