Download
1 / 55
550 likes | 822 Vues
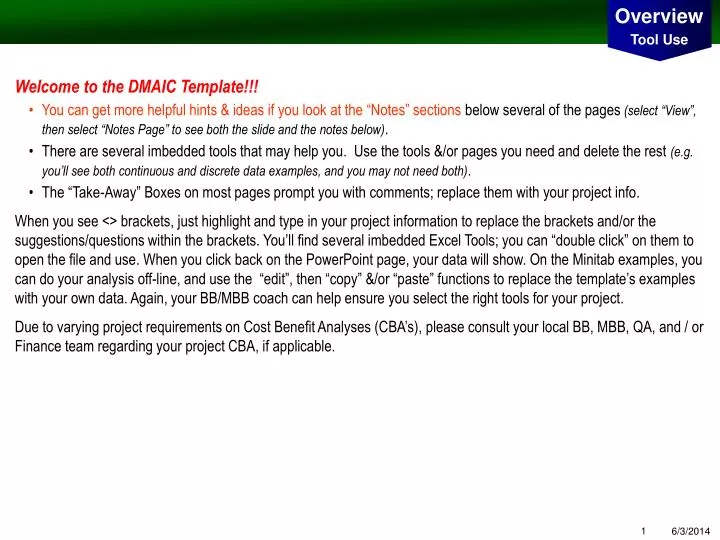
Overview Tool Use. Welcome to the DMAIC Template!!! You can get more helpful hints & ideas if you look at the “Notes” sections below several of the pages (select “View”, then select “Notes Page” to see both the slide and the notes below) .

E N D
Overview Tool Use • Welcome to the DMAIC Template!!! • You can get more helpful hints & ideas if you look at the “Notes” sections below several of the pages (select “View”, then select “Notes Page” to see both the slide and the notes below). • There are several imbedded tools that may help you. Use the tools &/or pages you need and delete the rest (e.g. you’ll see both continuous and discrete data examples, and you may not need both). • The “Take-Away” Boxes on most pages prompt you with comments; replace them with your project info. • When you see <> brackets, just highlight and type in your project information to replace the brackets and/or the suggestions/questions within the brackets. You’ll find several imbedded Excel Tools; you can “double click” on them to open the file and use. When you click back on the PowerPoint page, your data will show. On the Minitab examples, you can do your analysis off-line, and use the “edit”, then “copy” &/or “paste” functions to replace the template’s examples with your own data. Again, your BB/MBB coach can help ensure you select the right tools for your project. • Due to varying project requirements on Cost Benefit Analyses (CBA’s), please consult your local BB, MBB, QA, and / or Finance team regarding your project CBA, if applicable.
DMAIC <Company Name> <PROJECT NAME> Green Belt: <NAME> Champion: <NAME> Process Owner: <NAME> Black Belt: <NAME> Master Black Belt: <NAME> Other Team Members: <NAMES> Related Projects: <If Applicable> 2 6/3/2014
Overview Project Progress Overview Define Measure Analyze Improve Control Tollgates: Planned Completed mm/dd/yyyy mm/dd/yyyy mm/dd/yyyy mm/dd/yyyy mm/dd/yyyy mm/dd/yyyy mm/dd/yyyy mm/dd/yyyy mm/dd/yyyy mm/dd/yyyy C1. MSA on Xs C2. Improved Process Capability C3. Establish Control Plan I1. Screen for Vital Xs I2. Screen for vital Xs I3. Define Improved Process A1. Baseline Process A2. Performance Objective A3. Identify Drivers of Variation M1. CTQ Characteristics& Standards M2. Measurement System Analysis M3. Data Collection Steps: D1. Map Project D2. Approve Project Key Deliverables: • List of Customer(s) and Project CTQs • Team Charter • High Level Process Map (COPIS) • CAP Plan (Optional) • Preliminary CBA, if applicable • QFD / CTQ Tree • Operational definition, Specification limits, target, defect definition for Project Y(s) • Data Collection Plan • Measurement System Analysis • Baseline of Current Process Performance • Normality Test • Statistical Goal Statement for Project • List of Statistically Significant Xs • List of Vital Few Xs • Transfer Function(s) • Optimal Settings for Xs • Confirmation Runs/Results • Tolerances on Vital Few Xs • MSA Results on Xs • Post Improvement Capability • Statistical Confirmation of Improvements • Process Control Plan • Process Owner Signoff • Final CBA, if applicable • Basic Statistics • Histogram • Dot Plots • Box and Whisker Plots • Run Charts • Normality Testing • Continuous/Discrete Zst, Zlt • Benchmarking • Detailed Process Mapping • Moments of Truth • Nature of Work • Flow of Work • Fishbone • Hypothesis Testing • Regression Analysis • Other ______________ • Survey • Focus Groups • Interviews • ARMI, Stakeholder Analysis • In/Out of Frame • Threat vs. Opportunity Matrix • Other ______________ • DOE • Pugh Matrix • New Process Mapping • FMEA on new process • Process Modeling / Simulation • Other ______________ • Continuous Gauge R&R • Discrete Gauge R&R • Control Charts • Hypothesis Testing • CAP Plan • Control Plan • Other ______________ • QFD • FMEA (1st half) • Data Collection Plan • Continuous Gage R&R • Attribute Gage R&R • Sample Size Calculator • Other ______________ Tools:
<How Do My Customers See Me?> Define Step D1 Map Project Sample Comments (Delete this box prior to tollgate) This is set up as a table, so it will automatically adjust the box size to fit your text. Use your mouse to highlight the existing words, and replace with your project information. If you want to add or delete boxes, right click with your mouse on the desired table, and select “insert rows” or “delete rows”.
Define Step D1 Project Charter Business Case: <How would you describe the project to your general manager?> <Why is it URGENT that you do this project NOW?> <How does this link to your functions’ key initiatives?> <What would happen if you don’t address this? “So What?”> <If the Project is successful, what will be the positive impact on the business?> Start / Stop Points for Project: <What are the boundaries for the project?> In Scope: <What processes, systems, products, services, channels, etc. will you consider in this project?> Problem Statement: <HOW MUCH of a problem is there? (use real data or leave blanks to fill in when you get the data)> <When was the problem evident? (dates that the data represents or was collected)> <What is the impact of the problem (time, $, customer satisfaction, etc.)> Out of Scope: <What processes, systems, products, services, channels, etc. will you NOT consider in this project? If any of these will be addressed in a later project, mention it here.> (Delete this box prior to tollgate) Defect, Unit, & Opportunity are identified in Measure, so you can wait to Measure fill these in. It’s convenient to have your whole project summarized on one page, so we included these here. As you complete your project, you should modify this page to reflect what you learn about your problem. Defect:<text here> Unit:<text here> Opportunity:<text here> Goal Statement: (“SMART”: Specific, Measurable, Attainable, Relevant, Timebound) <By WHEN do you want to have the improvement in place?> <How much of an improvement are you aiming for, e.g. XX% defect reduction, XX% cycle time reduction)?> <What measurable business impact will the improvement have? Type? Magnitute?>
Define Step D1 COPIS 1. WHO are your primary customers?(From Step A) 2. WHAT does the customer receive? (Think of their CTQ’s) 3. What STEPS are Included in the Process today? (high level) 4. What is provided to START the process? 5. Who PROVIDES the input? Customer Output Process Input Supplier (Who) (Nouns) (Verbs) (Nouns) (Who) (Delete this box prior to tollgate) This page is set up with five tables. If you want to add or delete boxes, right click with your mouse on the desired table, and select “insert rows” or “delete rows”.
Identify Step to Complete the Process Identify Step to Start the Process Use Diamond Shape for Questions Define Step D1 Process Map Optional Process Map Person or Function or Process Person or Function or Process Person or Function or Process Person or Function or Process Person or Function or Process • Delete this Box prior to Tollgate. • To build a flowchart: • You can either copy boxes shown here and replace text with your process info OR • Click on AutoShapes • Select “Flow Chart” for the Desired Shapes: • Diamond for Questions • Rectangles for Process Steps • Rounded Box for Start / Stop • To Draw Lines • Click on AutoShapes • Select Connectors, which will automatically link boxes you select. • Start your line at your “From” step • End your line at the “To” step • For Decision Diamonds, The “Good” process should drop down, and any rework or bad steps should go to the side. Different Columns Can be used to Show different Process owners throughout The project. You can delete columns if you don’t need as many as shown here. Input your first process step here You can can also widen remaining columns if necessary to fit your process map on the page. You can copy these boxes and insert your process step information in them. N Y • Map Validated by: • <Name> • <Name>
Define Step D1 Change Stakeholder Analysis Optional Page (Delete this box prior to tollgate) This is set up as a table, so it will automatically adjust the box size to fit your text. Use your mouse to highlight the existing words and replace with your project information. If you want to add or delete rows, right click with your mouse on the desired table, and select “insert rows” or “delete rows”. For each stakeholder move your cursor to the desired box and type “X” for current state and “O” for desired state. • * When Populating the Stakeholder, consider the ARMI: • A= Approver of team decisions • R= Resource or subject matter expert (ad hoc) • M= Member of team • I= Interested Party who will need to be kept informed X = Where this Stakeholder IS TODAY on the Project O = Where this Stakeholder NEEDS TO BE on the Project
Potential Project Y Metrics <Insert text> <Insert text> <Insert text> <Insert text> <Insert text> CTQ Output Characteristic <Insert text> <Insert text> <Insert text> Measure Step M1 <Insert text> <Insert text> Strong relationship Moderate relationship Weak relationship CTQ Characteristics & Standards CTQ Drill Down Tree (Delete this box prior to tollgate) Double click to modify this CTQ Drill Down Tree tool to reflect your project info. When you click back in the PowerPoint slide, your info will show here. CTQ Translation Matrix (Delete this box prior to tollgate) To modify this CTQ Translation Matrix, use your mouse to highlight the existing words, and replace with your project information. You can copy these Symbols and paste on CTQ relationship chart above.
Measure Step M1 CTQ Characteristics & Standards QFD (Delete this box prior to tollgate) Double-click to open Excel Worksheet and enter data. You can use this QFD instead of prior page info if you prefer (delete slide if not used).
Measure Step M1 Performance Standards CTQ Performance Standards (Delete this box prior to tollgate) (If you prefer, we have an alternate layout for this page in the appendix). This is set up as a table, so it will automatically adjust the box size to fit your text. Use your mouse to click on the desired field, and type in your project information. If you want to add or delete rows, right click with your mouse on the table, and select “insert rows” or “delete rows”.
Can I Trust the Data? Measure Step M2 MSA Continuous Data Gauge R & R Gage R&R Study - ANOVA Method Source VarComp StdDev 5.15*Sigma Total Gage R&R 12.23 3.4966 18.0077 Repeatability 9.33 3.0548 15.7321 Reproducibility 2.89 1.7014 8.7624 Operator 2.89 1.7014 8.7624 Part-To-Part 205.48 14.3347 73.8236 Total Variation 217.71 14.7550 75.9881 Source %Contribution %Study Var %Tolerance Total Gage R&R 5.62 23.70 90.04 Repeatability 4.29 20.70 78.66 Reproducibility 1.33 11.53 43.81 Operator 1.33 11.53 43.81 Part-To-Part 94.38 97.15 369.12 Total Variation 100.00 100.00 379.94 Number of Distinct Categories = 6 (Delete this box prior to tollgate) Replace with your MSA Results from Minitab (Delete this page if not used).
Can I Trust the Data? Measure Step M2 MSA Attribute / Discrete Gauge R & R (Delete this box prior to tollgate) Replace this picture with your MSA Results from the Discrete Data Analysis Template. To access, you must be on line. Go to “Screen Show” mode and and click on this link to access: Attribute Gauge R&R Link (Delete this page if not used).
Measure Step M3 Data Collection Plan Sample Size Calculator (Delete this box prior to tollgate) After reading the notes section, double click on the applicable Excel Sheet above and enter your project data. Click back on PowerPoint slide to return to normal view. Erase the inputs for the calculator not used before your tollgate (delete slide if not used). See Appendix for examples.
Measure Step M3 Data Collection Plan (Delete this box prior to tollgate) Replace the example text with your project data (Delete slide if not used).
Is the data normal? Analyze Step A1 Normality Test Normality Test Example Data - replace with your Minitab output for continuous data only
Is the process stable? Analyze Step A1 Stability Run Chart Example Data - replace with your Minitab output for continuous data only
What do we look like ? Analyze Step A1 Shape Descriptive Stats Example Data - replace with your Minitab output for continuous data only
How Good Are We Today? Analyze Step A1 Process Capability Baseline Process Capability – Continuous Data Normality Test Continuous Data Example - Minitab ZST (Zbench) = .68 ZZLT (Zbench) = .68 Zshift = 0.00 DPMO = 307,619 Ho = Data is normal; Ha = Data is not normal If P >.05 Accept Ho; If P <.05 Reject Ho P value = 0.XXX Conclusion: Data is Normal / Non-Normal
How Good Are We Today? Analyze Step A2 Process Capability Baseline Process Capability – Discrete Data Discrete Data Example – Excel Spreadsheet Units = Defects= Opportunities = DPMO = Baseline Sigma = (Delete this box prior to tollgate) For Discrete Data, you can choose either Minitab or this Excel worksheet to calculate your baseline Sigma level.
Analyze Step A2 Performance Objectives # Sigma ST # Defects Opportunities DPMO Variation* Baseline Performance <> <> <> <> <> Project Target <> <> <> <> <> *continuous data only Rationale: (e.g. Benchmarking, 10X Improvement, etc.) ** Insert Financial Calculation as Attachment if Applicable for Your Project. How Good Should / Could We Be and What’s it Worth?
What factor(s) make a difference? Analyze Step A3 Identify Variation Sources (Xs) Fishbone Diagram* Potential Causes (Xs) Effect (Y) Environment Methods / Procedures Machines / Equipment Sample text for you to replace Sample text for you to replace Sample text for you to replace What are the Potential Causes of the Defect? (Enter it for your project in the form of a question) Sample text for you to replace Sample text for you to replace Sample text for you to replace Sample text for you to replace Sample text for you to replace Materials Measurement People * Also called a Cause & Effect Diagram
What factor(s) make a difference? Analyze Step A3 Identify Variation Sources (Xs) Pareto Chart Excel Spreadsheet Example Pareto (Delete this box prior to tollgate) For Excel: Sort Your Data, and Type in the Table Above, While also Updating the Defect Categories. The Graph Next to the Table Will Update Automatically. For Minitab: Delete the Excel table/graph, and follow directions below to replace this graph to the right with your Minitab Chart. Minitab Example Pareto
What factor(s) make a difference? Analyze Step A3 Identify Variation Sources (X’s) Histograms Box Plots Time Series Plot Dot Plot / Frequency Plot
Analyze Step A3 Is X Continuous or Discrete? Is X Continuous or Discrete? Variation or Centering? Normal or non-Normal? Normal or non-Normal? Comparing Relative to a Target? Comparing Only Two Samples? Statistical Test Decision Tree START: Is Y Continuous or Discrete? Continuous Discrete X (Factor) Continuous Discrete Continuous Discrete • T-tests • ANOVA • Probability Plot • Homogeneity of Variance • Mood’s Median • Scatter plot • Simple Regression • Multiple Regression Discrete Continuous Continuous Y (Response) Chi Square Regression • Logistic Regression • Chi Square • Chi Square Discrete Logistic Regression Scatter Plot Binomial Centering Variation Normal Non-Normal Normal Non-Normal Mood’s Median No No Homogeneity of Variance Bartlett Mann-Whitney Yes Yes Homogeneity of Variance F-Test Homogeneity of Variance Levine One Sample T-Test Two Sample T-Test Non-Parametric Tests ANOVA
Analyze Step A3 Identify Variation Sources (X’s) Hypothesis Testing - Homogeneity of Variance State your Null Hypothesis (H0): <There is no difference between “y with x” and “y without x”> State your Alternate Hypothesis (HA): <There is a difference between “y with x” and “y without x”> What is the Output Measure (y)? <Describe your output measure; should it be treated as discrete or continuous?> What is/are the Factor(s) (x)? <Describe your output measure; should it be treated as discrete or continuous?> What is the Risk ? Alpha = 0.05 Example – HOV What factor(s) make a difference (or don’t)?
Analyze Step A3 Identify Variation Sources (Xs) Hypothesis Testing - Regression State your Null Hypothesis (H0): <There is no difference between “y with x” and “y without x”> State your Alternate Hypothesis (HA): <There is a difference between “y with x” and “y without x”> What is the Output Measure (y)? <Describe your output measure; should it be treated as discrete or continuous?> What is/are the Factor(s) (x)? <Describe your output measure; should it be treated as discrete or continuous?> What is the Risk ? Alpha = 0.05 Example - Regression Output The regression equation is Total time (hrs) = 2.61 + 26.0 Processing Time Predictor Coef StDev T P Constant 2.6116 0.5521 4.73 0.000 Processing 26.049 1.234 21.11 0.000 S = 1.497 R-Sq = 83.7% R-Sq(adj) = 83.5% Transfer Function: Y = F(x1+x2+x3…) (See Writing a Transfer Function in Appendix) What factor(s) make a difference (or don’t)?
Analyze Step A3 Identify Variation Sources (Xs) Hypothesis Testing - ANOVA State your Null Hypothesis (H0): <There is no difference between “y with x” and “y without x”> State your Alternate Hypothesis (HA): <There is a difference between “y with x” and “y without x”> What is the Output Measure (y)? <Describe your output measure; should it be treated as discrete or continuous?> What is/are the Factor(s) (x)? <Describe your output measure; should it be treated as discrete or continuous?> What is the Risk ? Alpha = 0.05 Source DF SS MS F P Day 4 667.51 166.88 19.78 0.000 Error 102 860.44 8.44 Total 106 1527.96 Individual 95% CIs For Mean Based on Pooled StDev Level N Mean StDev -------+---------+---------+--------- Fri 19 12.184 1.924 (-----*----) Mon 20 12.462 2.261 (----*----) Thu 25 12.560 3.423 (---*----) Tue 21 18.800 3.569 (----*----) Wed 22 12.875 2.765 (----*---) -------+---------+---------+--------- Example – ANOVA Output What factor(s) make a difference (or don’t)?
Analyze Step A3 Identify Variation Sources (Xs) Hypothesis Testing - T-Test State your Null Hypothesis (H0): <There is no difference between “y with x” and “y without x”> State your Alternate Hypothesis (HA): <There is a difference between “y with x” and “y without x”> What is the Output Measure (y)? <Describe your output measure; should it be treated as discrete or continuous?> What is/are the Factor(s) (x)? <Describe your output measure; should it be treated as discrete or continuous?> What is the Risk ? Alpha = 0.05 Two Sample T-Test and Confidence Interval Two sample T for A vs B N Mean StDev SE Mean A 20 17042 13583 3037 B 21 32362 19933 4350 95% CI for mu A - mu B: ( -26090, -4550) T-Test mu A = mu B (vs not =): T = -2.89 P = 0.0066 DF = 35 Example – T-Test Output What factor(s) make a difference (or don’t)?
Analyze Step A3 Identify Variation Sources (Xs) Hypothesis Testing - Moods Median State your Null Hypothesis (H0): <There is no difference between “y with x” and “y without x”> State your Alternate Hypothesis (HA): <There is a difference between “y with x” and “y without x”> What is the Output Measure (y)? <Describe your output measure; should it be treated as discrete or continuous?> What is/are the Factor(s) (x)? <Describe your output measure; should it be treated as discrete or continuous?> What is the Risk ? Alpha = 0.05 Mood Median Test Mood median test for Total time Chi-Square = 23.23 DF = 4 P = 0.000 Individual 95.0% CIs Day N<= N> Median Q3-Q1 ----+---------+---------+---------+-- Fri 13 6 12.00 2.75 (--+---) Mon 13 7 12.00 2.37 (--+--) Thu 15 10 12.00 2.00 (-+--) Tue 1 20 18.00 5.25 (---+--------) Wed 13 9 12.50 3.00 (---+----) ----+---------+---------+---------+-- 12.0 15.0 18.0 21.0 Example – Mood’s Median What factor(s) make a difference (or don’t)?
Analyze Step A3 Identify Variation Sources (Xs) Hypothesis Testing - Chi Square Example – Chi Square Output State your Null Hypothesis (H0): <There is no difference between “y with x” and “y without x”> State your Alternate Hypothesis (HA): <There is a difference between “y with x” and “y without x”> What is the Output Measure (y)? <Describe your output measure; should it be treated as discrete or continuous?> What is/are the Factor(s) (x)? <Describe your output measure; should it be treated as discrete or continuous?> What is the Risk ? Alpha = 0.05 Expected counts are printed below observed counts Errors Correct Total 1 33 60 93 40.46 52.54 2 27 67 94 40.90 53.10 3 132 114 246 107.03 138.97 4 32 132 164 71.35 92.65 5 168 136 304 132.26 171.74 Total 392 509 901 Chi-Sq = 1.376 + 1.060 + 4.722 + 3.637 + 5.827 + 4.487 + 21.703 + 16.714 + 9.657 + 7.437 = 76.620 DF = 4, P-Value = 0.000 What factor(s) make a difference (or don’t)?
What is the Optimum Improvement Option? Improve Action Workout 4-Blocker Impact / Effort Matrix Impact Action Workout 4-Blocker: 1 – high impact, easy to do 2 – low impact, easy to do 3 – high impact, not so easy to do 4 – low impact, not so easy to do High Low 1 2 Easy Which Option works best for you? Why? <Enter the name of the best improvement option and briefly describe why it fits into the category that you selected> Implementation 3 4 Hard
Identify Step to Complete the Process Identify Step to Start the Process Use Diamond Shape for Questions How Have I Improved The Process? Improve Improved Process Map Person or Function or Process Person or Function or Process Person or Function or Process Person or Function or Process Person or Function or Process Different Columns Can be used to Show different Process owners throughout The project. You can delete columns if you don’t need as many as shown here. Input your first process step here You can can also widen remaining columns if necessary to fit your process map on the page. You can copy these boxes and insert your process step information in them.
How Tight Does My Control Need to Be? Improve Failure Modes & Effects Analysis FMEA (Delete this box prior to tollgate) Double Click to Open Excel Spreadsheet. See Appendix for scoring guidelines.
Improve Pilot Improvement Pilot Solution • Objectives • 1. (e.g., determine user acceptance, test with customer...) • (e.g., evaluate cycle time reduction, increase in accuracy...) • Method: (1-2 sentence description of sample size, extent of testing) • Results: (1-2 sentence description of testing results, and process changes as a result) Communicate Solution (1-2 sentence description of communication plan) Train Users / Processors (1-2 sentence description of training plan)
Control Step C1 Measurement System - Xs (Delete this box prior to tollgate) Replace the example text with your project data (Delete this page if not used).
Can I Trust the Data? Control Step C1 Measurement System - Xs Continuous Data Gauge R & R Gage R&R Study - ANOVA Method Source VarComp StdDev 5.15*Sigma Total Gage R&R 12.23 3.4966 18.0077 Repeatability 9.33 3.0548 15.7321 Reproducibility 2.89 1.7014 8.7624 Operator 2.89 1.7014 8.7624 Part-To-Part 205.48 14.3347 73.8236 Total Variation 217.71 14.7550 75.9881 Source %Contribution %Study Var %Tolerance Total Gage R&R 5.62 23.70 90.04 Repeatability 4.29 20.70 78.66 Reproducibility 1.33 11.53 43.81 Operator 1.33 11.53 43.81 Part-To-Part 94.38 97.15 369.12 Total Variation 100.00 100.00 379.94 Number of Distinct Categories = 6 (Delete this box prior to tollgate) Replace with your MSA Results from Minitab (Delete this page if not used).
Can I Trust the Data? Control Step C1 Measurement System - Xs Attribute / Discrete Gauge R & R (Delete this box prior to tollgate) Replace this picture with your MSA Results from the Discrete Data Analysis Template. To access, you must be on line. Go to “Screen Show” mode and and click on this link to access: Attribute Gauge R&R Link (Delete this page if not used).
Is the data normal? Control Step C2 Normality Test Normality Test Example Data - replace with your Minitab output for continuous data only
Is the process stable? Control Step C2 Stability Run Chart Example Data - replace with your Minitab output for continuous data only
What do we look like ? Control Step C2 Shape Descriptive Stats Example Data - replace with your Minitab output for continuous data only
How Good Are We Today? Control Step C2 Process Capability Baseline Process Capability – Continuous Data Normality Test Continuous Data Example - Minitab ZST (Zbench) = .68 ZZLT (Zbench) = .68 Zshift = 0.00 DPMO = 307,619 Ho = Data is normal; Ha = Data is not normal If P >.05 Accept Ho; If P <.05 Reject Ho P value = 0.XXX Conclusion: Data is Normal / Non-Normal
How Good Are We Today? Control Step C2 Process Capability Baseline Process Capability – Discrete Data Discrete Data Example – Excel Spreadsheet Units = Defects= Opportunities = DPMO = Baseline Sigma = (Delete this box prior to tollgate) For Discrete Data, you can choose either Minitab or this Excel worksheet to calculate your baseline Sigma level.
In Minitab, set up your worksheet exactly like the picture – Select STAT>Tables>Chi Square Test (see notes below) DELETE the enclosed sections before your tollgate Have I Reached My Goal? Control Step C2 Determine Process Capability (Y) Before & After Performance Assessment Defects Units Opportunities DPMO Sigma Baseline (Before Project) 897 1000 1000 897000 .24 New (After Project) 12 1000 1000 12000 3.76 Defects Units Opportun Total 1 897 1000 1000 2897 536.44 1180.28 1180.28 2 12 1000 1000 2012 372.56 819.72 819.72 Total 909 2000 2000 4909 Chi-Sq =242.349 + 27.537 + 27.537 + 348.949 + 39.649 + 39.649 = 725.670 DF = 2, P-Value = 0.000 H0=There is no difference between the baseline and the new Process Capability HA = There is a difference between the baseline and the new Process Capability If P > .05 there is no difference between the Processes If P < .05 there is a difference between the Processes Replace with Your Project Data
How Can I Sustain the Improvement? Control Step C3 Implement Process Control Results TEST 1. One point more than 3.00 sigmas from center line. Test Failed at points: 4 EXAMPLE (Delete this box prior to tollgate) Replace the Example with the Control Chart from Minitab with your project data .
How Can I Sustain the Improvement? Control Step C3 Implement Process Control Documentation • What kind of documentation is available?<e.g. Checklist, Manual, Improved Process Map> • Where is the documentation located?<specifically describe the location, e.g. drive mapping> • Who has access to the information? <Names of people or department> • Who will be responsible for updating the information? <Names of people or department> • How is documentation / file change control managed? <How is documentation protected from unauthorized changes?> Turnover to the Business • Has the business agreed to accept this process?<YES or NO> • Who owns the new process?<Name & Role of the person or department> • Who runs the new process?<Name & Role of the person or department> • Has this person(s) been properly trained?<YES or NO> • Who monitors the new process and metrics?<Name of the person or department> • What would happen if you were not available?<Is there an FMEA to aid in troubleshooting? Where else can the new process owner get support?>
Control Step C3 Implement Process Control Documentation The Plan For Doing The Work Monitoring Checking the Work Response Plan The Response to Special Causes Method for Recording the Data Procedure for Process Adjustment Procedure for System Improvement Key Process and Output Measures Detail on Key Tasks Monitoring Standards Deployment Flowchart Containment P.B MORNING OPS IT START To change email recipients contact Help Desk. Route case to DBA See Mail Room Control Document Email Received? NO Call Help Desk Correct Control for X1 YES STOP START PROCESS WS Working? See Mail Room Control Document NO Call Help Desk Correct Control for X1 OPTIONAL: Process Management Chart SAMPLE YES Scan Policy % mailings with no data Address Difference? YES Investigate Investigate when # of differences is out of control or sigma goes below 4.. To make adjustments to World Ship, contact Andre Smith in Operations To make adjustments to World Ship, contact Andre Smith in Operations World Ship Mailing Accuracy Sigma NO Label and Mail Record on Checksheet Checksheet: L:\quality\shared/ WorldShip Control/Checksheet % mailings with differences where World Ship is wrong 100% of these errors to be forwarded to Ops in email Control for X2 and X3 STOP Transfer Checksheet To Minitab EVENING Minitab: L:\quality\shared/ WorldShip Control/Control File Email GN25 related to Chris Cosci and Replacement related to Doreen Martin WEEKLY Mgr 1. Meeting 2. Cont Chrt 3. Sigma Email Ops Errors Train Ops Team Control for X2 and X3
Appendix APPENDIX
Appendix Project Deliverables (HOW’s) Major Process Steps (HOW’s) Major Tasks (HOW’s) Select the CTQ Characteristic (Y) • 1. Drill-down into your CTQ (Big Y) to determine key drivers (little y’s) and their process and input drivers (X’s) • 2. Evaluate the amount of IMPACT each driver (y) on your CTQ, and the CONTROL you have to change each driver (y) • 3. Select the key driver (y) to focus on for the rest of the project. Note, “y” • is measurable • could be a characteristic about the main process • could be a characteristic of a sub-process House of Quality # 1 House of Quality # 2 Customer CTQs (WHAT’s) House of Quality # 3 Key Project Deliverables (WHAT’s) Key Process Steps (WHAT’s) Key Project Deliverables Key Process Steps Key Tasks
Appendix Define CTQ Performance Standards Start with the VOC Translation Matrix in Step 1 Basic Statistics for Continuous Data Project Y Measure <Fill in your project Y> Operational Definition <Fill in Your Operational Definition for Project Y Measure> Needs Statement <Fill in what your customer wants> CTQ Target/Nominal Value <What is your target?> (Delete this box prior to tollgate) You can copy this page as many times as necessary to cover the CTQ’s identified (delete slide if not used) Specification/Tolerance limit(s) <Define your tolerance>