Download
1 / 15
150 likes | 293 Vues
Linear Hierarchical Models . Corinne Iola Giorgia Silani. SPM for Dummies. Outline. Fixed Effects versus Random Effects Analysis: how linear hierarchical models work Single-subject Multi-subjects Population studies. RFX: an example of hierarchical model.

E N D
Linear Hierarchical Models Corinne Iola Giorgia Silani SPM for Dummies
Outline • Fixed Effects versus Random Effects Analysis: how linear hierarchical models work • Single-subject • Multi-subjects • Population studies
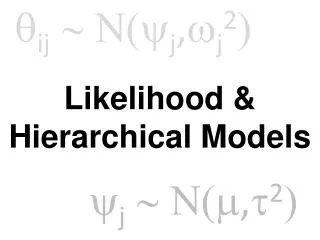
RFX: an example of hierarchical model Y = X(1)(1) + e(1)(1st level) – within subject : (1) = X(2)(2) + e(2) (2nd level) – between subject Y = scans from all subjects X(n) = design matrix at nth level (n)= parameters - basically the s of the GLM e(n) = N(m,2) error we assume there is a Gaussian distribution with a mean (m) and variation (2)
Hierarchical form 1st level y = X(1) (1) +(1) 2nd level (1) = X(2) (2) +(2)
Random Effects Analysis: why? • Interested in individual differences, but also • …interested in what is common As experimentalists we know… • each subjects’ response varies from trial to trial (with-in subject variability) • Also, responses vary from subject to subject (between subject variability) • Both these are important when we make inference about the population
Random Effects Analysis : why? • with-in subject variability – Fixed effects analysis (FFX) or 1st level analysis • Used to report case studies • Not possible to make formal inferences at population level • with-in and between subject variability – Random Effect analysis (RFX) or 2nd level analysis • possible to make formal inferences at population level
How do we perform a RFX? • RFX (Parameter and Hyperparameters (Variance components)) can be estimated using summary statistics or EM (ReML) algorithm • The gold standard approach to parameter and hyperparameter is the EM (expectation maximization)….(but takes more time…) • EM • estimates population mean effect as MEANEM • the variance of this estimate as VAREM • For N subjects, n scans per subject and equal within-subject variance we have VAREM = Var-between/N + Var-within/Nn • Summary statistics • Avg[a] • Avg[Var(a)] • However, for balanced designs (N~12 and same n scans per subject). • Avg[a] = MEANEM • Avg[Var(a)] = VAREM
Random Effects Analysis • Multi - subject PET study • Assumption - that the subjects are drawn at random from the normal distributed population • If we only take into account the within subject variability we get the fixed effect analysis (i.e. 1st level - multisubject analysis) • If we take both within and between subjects we get random effects analysis (2nd level analysis)
1 ^ s21 with -in Single-subject FFX t = ___ Subj1= -1 1 0 0 0 0 0 0 0 0
<i> ^ <s2i> with -in Multi-subject FFX t = ___ Group= -1 1 -1 1 -1 1 -1 1 -1 1
<i> ^ ^ <s2i> + with -in <s2i> between RFX analysis t = ________ } Subj1= -1 1 0 0 0 0 0 0 0 0 Subj2= 0 0 -1 1 0 0 0 0 0 0 @2nd level Subj5= 0 0 0 0 0 0 0 0 -1 1
^ ^ ^ ^ ^ 11 12 1 2 ^ ^ ^ ^ 2 12 1 11 Random Effects Analysis : an fMRI study 1st Level 2nd Level DataDesign MatrixContrast Images SPM(t) One-sample t-test @2nd level
Two populations Estimated population means Contrast images Two-sample t-test @2nd level
Example: Multi-session study of auditory processing SS results EM results Friston et al. (2003) Mixed effects and fMRI studies, Submitted.