Download
1 / 10
100 likes | 319 Vues
Scatter Plot Graphing. By: Julia Garcia Juliana Bove Kelli Koenig Period 5. Introduction. Definition: A graph in which two sets of data are plotted as ordered pairs in a coordinate plane. Used to find the relationship between multiple sets of data. Numerical data is used. Explanation .

E N D
Scatter Plot Graphing By: Julia Garcia Juliana Bove Kelli Koenig Period 5
Introduction • Definition: A graph in which two sets of data are plotted as ordered pairs in a coordinate plane. • Used to find the relationship between multiple sets of data. • Numerical data is used.
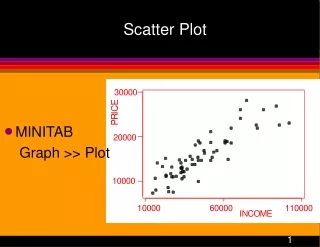
Explanation • Collect data as ordered pair • Make graph and plot points • Determine the correlation/relationship (positive, negative, or none)
Constructed Example • Social Media Apps and Sleep
Problem/Meaning • Does the amount of social media apps on your phone or iPod effect the average amount of sleep you get? • There is no correlation between the two variables, so they don’t affect one another.
Real-Life Graph • Babe Ruth’s Homeruns
Problem/Meaning • Do years of experience effect the amount of homeruns Babe Ruth scored in baseball from 1918 to 1927? • There’s a positive correlation which means the years of experience does affect the amount of homeruns hit.
Advantages • They can be used to display large amounts of data. • Easy to analyze relationships between two quantities. • Easy to predict what is coming next in data.
disadvantages • Can be hard to read because of overplotting. • Takes a long time to graph. • Hard to tell where exactly a point is placed if it’s not on an intersection.
Works Cited • www.yahoo.com • www.google.com • www.baseball-almanac.com • www.baberuthcentral.com • Glenoce McGraw-Hill Algebra 1 Textbook