Download
1 / 6
70 likes | 197 Vues
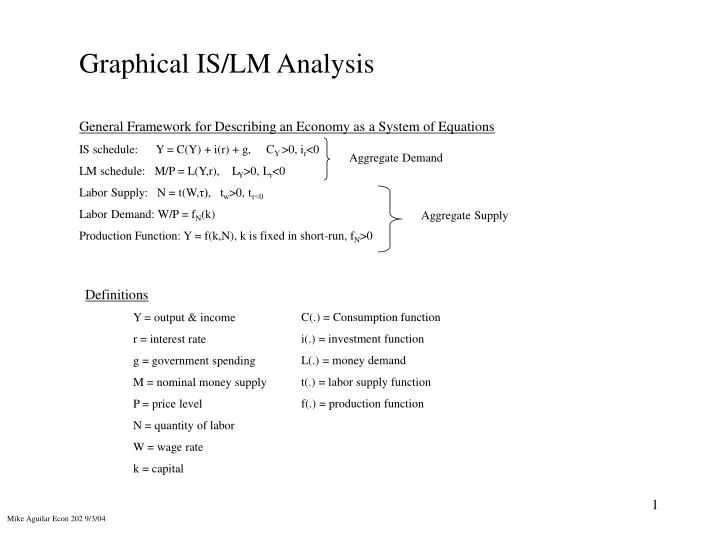
Graphical IS/LM Analysis. General Framework for Describing an Economy as a System of Equations IS schedule: Y = C(Y) + i(r) + g, C Y >0, i r <0 LM schedule: M/P = L(Y,r), L Y >0, L r <0 Labor Supply: N = t(W, τ), t w >0, t τ<0 Labor Demand: W/P = f N (k)

E N D
Graphical IS/LM Analysis General Framework for Describing an Economy as a System of Equations IS schedule: Y = C(Y) + i(r) + g, CY >0, ir<0 LM schedule: M/P = L(Y,r), LY>0, Lr<0 Labor Supply: N = t(W,τ), tw>0, tτ<0 Labor Demand: W/P = fN(k) Production Function: Y = f(k,N), k is fixed in short-run, fN>0 Aggregate Demand Aggregate Supply Definitions C(.) = Consumption function i(.) = investment function L(.) = money demand t(.) = labor supply function f(.) = production function Y = output & income r = interest rate g = government spending M = nominal money supply P = price level N = quantity of labor W = wage rate k = capital Mike Aguilar Econ 202 9/3/04
r P P Y Y Y W/P Y N N Aggregate Demand Construction LM(M/P0) LM(M/P1) P0 P1 AD IS Y1 Y0 Y0 Y1 Aggregate Supply Construction AS Y0 P1 W/P0 Y1 W/P1 P0 N0 N0 N1 Y0 Y1 N1
r P Y Y W/P Y IS(g0) N N A sample Economy: Y = c(Y) + i(r) + g, CY >0, ir<0 M/P = L(Y,r), LY>0, Lr<0 W/P = fN(k) (W is fixed) Y = f(k,N), fN>0 What happens when we shock this economy? How do output, employment, etc.. Change? Example 1: Fiscal Policy Shock – g LM(P1) AS LM(Po) P1 P0 AD(g0) IS(g1) AD(g0) Y0 Y2 Y1 Y0 Y2 Y1
r P Y Y W/P Y IS N N A sample Economy: Y = c(Y) + i(r) + g, CY >0, ir<0 M/P = L(Y,r), LY>0, Lr<0 W/P = fN(k) (W is fixed) Y = f(k,N), fN>0 What happens when we shock this economy? How do output, employment, etc.. Change? Example 2: Monetary Policy Shock – M LM(M0/P0) AS LM(M1/P1) LM(M1/P0) P1 P0 AD(M1) AD(M0) Y0 Y2 Y1 Y0 Y2 Y1