Download
1 / 42
420 likes | 530 Vues
6. 6. 5. 5. 4. 4. 3. 3. 2. 2. 1. 1. 1. 1. 2. 2. 3. 3. 4. 4. 5. 5. 6. 6. Bell Work…. Graph the following equations. 1. 2. Solving Systems of Equations. Graphing Linear Inequalities. Objectives. How do we graph an inequality Define a boundary line

E N D
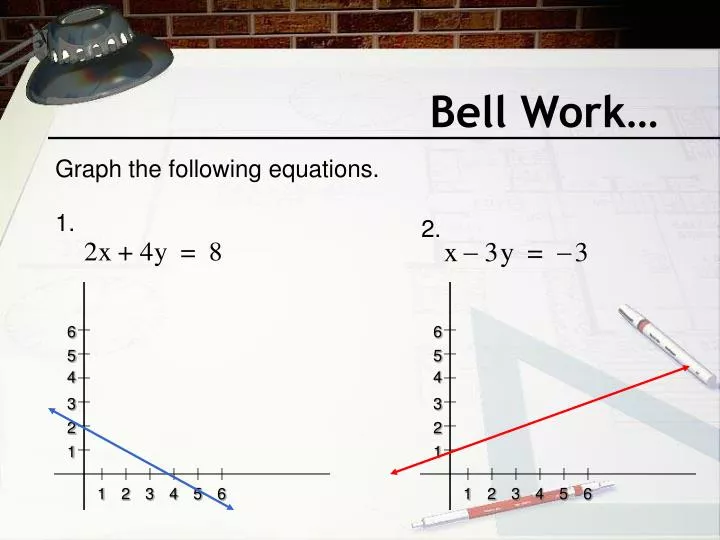
6 6 5 5 4 4 3 3 2 2 1 1 1 1 2 2 3 3 4 4 5 5 6 6 Bell Work… Graph the following equations. 1. 2.
Solving Systems of Equations Graphing Linear Inequalities
Objectives • How do we graph an inequality • Define a boundary line • Graphing a boundary line • Define the solution for a system of inequalities • Find the solution of a system of inequalities
What is the solution of an inequality • Solution of an inequality are all the ordered pairs (points) that make the inequality true.
Graph Graphing Inequalities Consider the inequality y ≥ x y = x REMEMBER: Solution are all the ordered pairs (points) that make the inequality true. 6 5 4 3 Boundary line 2 1 1 2 3 4 5 6
Graphing Inequalities Consider the inequality y ≥ x Pick two points from each side of the graph 6 5 4 (1,3) 3 2 (4,1) 1 1 2 3 4 5 6
substitute into Graphing Inequalities Consider the inequality y ≥ x Check points if they make inequality true. (1,3) y ≥ x 6 5 4 (1,3) 3 2 (4,1) 1 1 2 3 4 5 6
Graphing Inequalities Consider the inequality y ≥ x Check points if they make inequality true. (1,3) y ≥ x 6 substitute into 3 ≥ 1 5 4 (1,3) 3 2 (4,1) 1 1 2 3 4 5 6
Graphing Inequalities Consider the inequality y ≥ x Check points if they make inequality true. (1,3) y ≥ x 6 substitute into 3 ≥ 1 5 4 (1,3) 3 2 (4,1) 1 1 2 3 4 5 6
substitute into Graphing Inequalities Consider the inequality y ≥ x Check points if they make inequality true. (4,1) y ≥ x 6 5 4 (1,3) 3 2 (4,1) 1 1 2 3 4 5 6
Graphing Inequalities Consider the inequality y ≥ x Check points if they make inequality true. (4,1) y ≥ x 6 substitute into 1 ≥ 4 5 4 (1,3) 3 2 (4,1) 1 1 2 3 4 5 6
Graphing Inequalities Consider the inequality y ≥ x Check points if they make inequality true. (4,1) y ≥ x 6 substitute into 1 ≥ 4 X 5 4 (1,3) 3 2 X (4,1) 1 1 2 3 4 5 6
Graphing Inequalities Consider the inequality y ≥ x Shade the side where the correct point lies. 6 5 4 (1,3) 3 2 X (4,1) 1 1 2 3 4 5 6
Graphing Inequalities Consider the inequality y ≥ x Shade the side where the correct point lies. 6 5 4 (1,3) 3 2 1 1 2 3 4 5 6
1 y = x - 2 2 Graphing Inequalities Consider the inequality x - 2y ≤ 4 x - 2y = 4 Graph 3 2 1 1 2 3 4 5 6 -1 -2
1 y = x - 2 2 (0,1) (6,0) Graphing Inequalities Consider the inequality x - 2y ≤ 4 x - 2y = 4 Graph ¡¡TEST POINTS !! 3 2 1 1 2 3 4 5 6 -1 -2
substitute into Graphing Inequalities Consider the inequality x - 2y ≤ 4 (0,1) x - 2y ≤ 4 3 2 (0,1) 1 (6,0) 1 2 3 4 5 6 -1 -2
Graphing Inequalities Consider the inequality x - 2y ≤ 4 (0,1) x - 2y ≤ 4 substitute into 0 - 2(1) ≤ 4 -2 ≤ 4 3 2 (0,1) 1 (6,0) 1 2 3 4 5 6 -1 -2
Graphing Inequalities Consider the inequality x - 2y ≤ 4 (6,0) x - 2y ≤ 4 substitute into 3 2 (0,1) 1 (6,0) 1 2 3 4 5 6 -1 -2
Graphing Inequalities Consider the inequality x - 2y ≤ 4 (6,0) x - 2y ≤ 4 substitute into 6 - 2(0) ≤ 4 X 6 ≤ 4 3 2 (0,1) 1 (6,0) X 1 2 3 4 5 6 -1 -2
Graphing Inequalities Consider the inequality x - 2y ≤ 4 ¡¡ SHADE CORRECT REGION !! 3 2 (0,1) 1 (6,0) X 1 2 3 4 5 6 -1 -2
2 GRAPH y = x + 3 3 6 5 4 3 2 1 1 2 3 4 5 6 Examples 1. 3y - 2x ≥ 9
(0,5) 6 5 4 3 (3,0) 2 1 1 2 3 4 5 6 Examples 1. 3y - 2x ≥ 9 2 GRAPH y = x + 3 3 TEST!! (0, 5) 3(5) - 2(0) ≥ 9 15 - 0 ≥ 9 X
(0,5) 1 y = x + 1 3 6 Graph 5 4 3 2 1 1 2 3 4 5 6 Examples 2. x - 3y > -3 TEST!! (0, 5) X 0 - 3(5) > -3 0 - 15 > -3 X
3 2 1 -3 -2 -1 1 2 3 -1 Solving a system of Inequalities Consider the system x + y ≥ -1 -2x + y < 2
Graph 3 2 (0,0) 1 -3 -2 -1 1 2 3 -1 Solving a system of Inequalities Consider the system x + y ≥ -1 -2x + y < 2 y = - x - 1 TEST: (0,0) 0 + 0 ≥ -1 0 ≥ -1
Graph 3 2 1 -3 -2 -1 1 2 3 (0,0) -1 Solving a system of Inequalities Consider the system x + y ≥ -1 -2x + y < 2 y = 2x + 2 TEST: (0,0) -2(0) + 0 < 2 0 < 2
3 3 2 2 1 1 -3 -3 -2 -2 -1 -1 1 1 2 2 3 3 -1 -1 x + y ≥ -1 -2x + y < 2
3 2 1 -3 -2 -1 1 2 3 -1 Solving a system of Inequalities Consider the system x + y ≥ -1 -2x + y < 2 SOLUTION: • Lies where the two shaded • regions intersect each • other.
Graph 3 2 y = x - 2 1 (0,0) -2 -1 1 2 3 4 2 3 Solving a system of Inequalities Consider the system -2x + 3y < -6 5x + 4y < 12 X TEST: (0,0) -2(0) + 3(0) < -6 -1 0 < -6 X -2
Graph 3 2 y = - x + 3 1 (0,0) -2 -1 1 2 3 4 5 4 Solving a system of Inequalities Consider the system -2x + 3y < -6 5x + 4y < 12 TEST: (0,0) 5(0) + 4(0) < 12 -1 0 < 12 -2
Graph 3 2 1 (0,0) -2 -1 1 2 3 4 Solving a system of Inequalities Consider the system -2x + 3y < -6 5x + 4y < 12 SOLUTION: • Lies where the two shaded • regions intersect each • other. -1 -2
Graph 3 2 1 (0,0) -2 -1 1 2 3 4 Solving a system of Inequalities Consider the system -2x + 3y < -6 5x + 4y < 12 NOTE: • All order pairs in dark • region are true in both • inequalities. -1 -2
Graph 6 4 2 (0,0) 2 4 6 8 10 12 -2 -4 -6 Solving a system of Inequalities Consider the system x - 4y ≤ 12 4y + x ≤ 12 TEST: (0,0) (0) - 4(0) ≤ 12 0 - 0 ≤ 12 0 ≤ 12
Graph 6 4 2 (0,0) 2 4 6 8 10 12 -2 -4 -6 Solving a system of Inequalities Consider the system x - 4y ≤ 12 4y + x ≤ 12 TEST: (0,0) 4(0) + (0) ≤ 12 0 ≤ 12
HOMEWORK… Finish pg. 289 #8-16 (solve the system of inequalities by graphing) #19 and 20.
Problem Model Patricio’s family, on average, drives their SUV more than twice as many miles as they drive their car. His family’s car emits 0.75 pounds of CO2 per mile and the SUV emits 1.25 pounds of CO2 per mile. Patricio is concern with the environment and convinces his family to limit the total CO2 emissions to less than 600 pounds per month. How many miles can they drive their car and SUV to meet this limit? x = SUV miles x > 2y = Car miles y 0.75y + 1.25x < 600
x > 2y 0.75y + 1.25y < 600 Problem Model
Problem Model The science club can spend at most $400 on a field trip to a dinosaur exhibit. It has enough chaperones to allow at most 100 students to go on the trip. The exhibit costs $3.00 for students 12 and under and $6.00 for students 12 and over. How many students 12 years and under can go if 20 students over 12 go? x = Students 12 and under x + y ≤ 100 = Students 12 and over y 3x + 4y ≤ 400
Problem Model x + y ≤ 100 3x + 4y ≤ 400
Now you try… The Math Club want to advertise their fundraiser each week in the school paper. They know that a front-page ad is more effective than an ad inside the paper. They have a total of $30 budget for advertising. It costs $2 for each front-page ad and $1 for each inside-page ad. If the club wants to advertise at least 20 times, what are the different possibilities for the number of front-page and inside-page ads. x = front-page ads x + y ≤ 20 = inside-page ads y 2x + 1y ≤ 30
Now you try… x + y ≤ 20 2x + 1y ≤ 30