Download
1 / 140
1.4k likes | 1.52k Vues
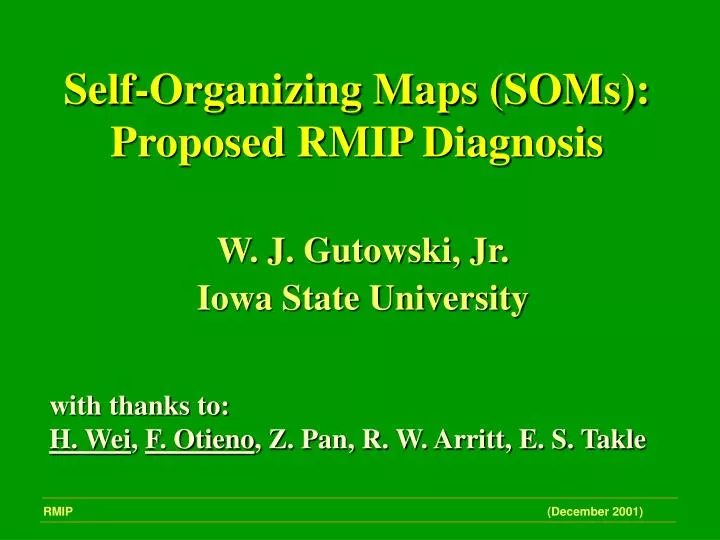
Self-Organizing Maps (SOMs): Proposed RMIP Diagnosis. W. J. Gutowski, Jr. Iowa State University. with thanks to: H. Wei , F. Otieno , Z. Pan, R. W. Arritt, E. S. Takle. RMIP (December 2001). Outline. Background Example 1: Precipitation simulation versus observations

E N D
Self-Organizing Maps (SOMs):Proposed RMIP Diagnosis W. J. Gutowski, Jr. Iowa State University with thanks to: H. Wei, F. Otieno, Z. Pan, R. W. Arritt, E. S. Takle RMIP (December 2001)
Outline • Background • Example 1: Precipitation simulation versus observations • Example 2: RMIP sea-level pressure behavior • Summary RMIP (December 2001)
Self-Organizing Maps: Background • Set of maps • Show characteristic data structures • Trained to distribution of data • Give 2-D projection of higher order • map space • Are approximately continuous • Basis in Artificial Neural Nets
Compare sample to ... … existing set
Find closest map ...(here - smallest RMS difference) … and it nudge toward sample
Nudge also a surrounding region ... … that decreases with iteration
Nudge also a surrounding region ... … that decreases with iteration
Nudge also a surrounding region ... … that decreases with iteration
Outline • Background • Example 1: Precipitation simulation versus observations • Example 2: RMIP sea-level pressure behavior • Summary RMIP (December 2001)
SOM: Major Dimensions 1 “warm” 2 “cold” 0 [mm/mo] 100 200
SOM Trajectories RegCM VEMAP J-J-A
SOM Trajectories RegCM VEMAP J-J-A RegCM D-J-F VEMAP D-J-F
SOM: Lowest two rows 0 [mm/mo] 100 200
Outline • Background • Example 1: Precipitation simulation versus observations • Example 2: RMIP sea-level pressure behavior • Summary RMIP (December 2001)
RMIP Sea-level Pressure • Input: • ISU MM5 simulation • Sampled daily at 12 UTC • 18 months 549 samples • Unadjusted (e.g., no filtering, scaling, etc.)
“Nearest map” Frequency 5 4 3 2 1 0 Even distribution 0.04 0 1 2 3
Mean Squared Error of Fit - All Days 5 4 3 2 1 0 [hPa2] 0 1 2 3
“Nearest map” Frequency - Summer 5 4 3 2 1 0 0 1 2 3
“Nearest map” Frequency - Fall 5 4 3 2 1 0 0 1 2 3
“Nearest map” Frequency - Winter 5 4 3 2 1 0 0 1 2 3
“Nearest map” Frequency - Spring 5 4 3 2 1 0 0 1 2 3