Download
1 / 54
560 likes | 802 Vues
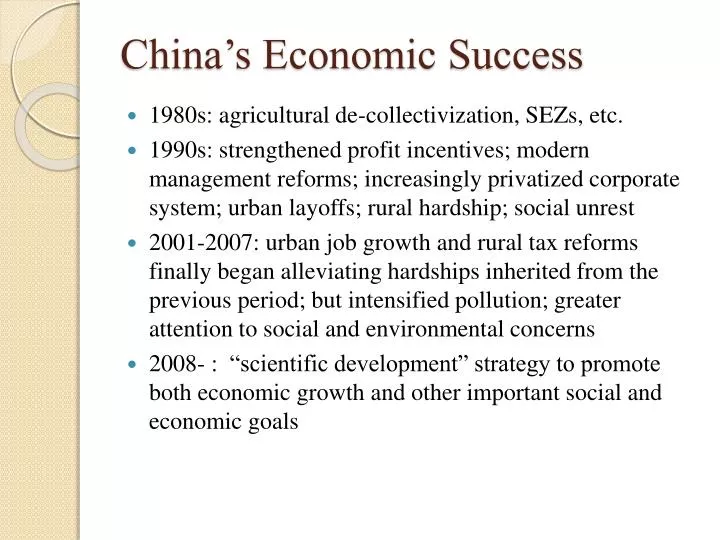
China’s Economic Success. 1980s: agricultural de-collectivization, SEZs, etc. 1990s: strengthened profit incentives; modern management reforms; increasingly privatized corporate system; urban layoffs; rural hardship; social unrest

E N D
China’s Economic Success • 1980s: agricultural de-collectivization, SEZs, etc. • 1990s: strengthened profit incentives; modern management reforms; increasingly privatized corporate system; urban layoffs; rural hardship; social unrest • 2001-2007: urban job growth and rural tax reforms finally began alleviating hardships inherited from the previous period; but intensified pollution; greater attention to social and environmental concerns • 2008- : “scientific development” strategy to promote both economic growth and other important social and economic goals
Exports: not China’s Engine of Growth • Domestic shifts in investment and consumption have been responsible for China’s growth • The contributions to growth from the country’s trade surplus have had secondary importance
Currency Exchange Rate: A Secondary Influence at Best • China’s exchange rate has remained fairly stable: $ weakened, but the euro strengthened, RMB shifts split the difference between these two major currencies • Currency misalignment not a convincing explanation for China’s trade surplus. China’s global trade surplus is rather small before 2004. The large increase in trade surplus after 2004 had domestic economic origins: tightened credit and reduced investment slowed imports
Size of the Chinese economy 2010 GDP $5.9 trillion (compared to $14.7 trillion for the U.S.) China’s total economy will be twice as large as America’s by midcentury, while its standard of living will be only two-thirds of America’s at that time
The Effect of Size on the Chinese Economy • Disadvantages: global attention need for natural resources and commodities constraints on economic growth • Advantages: economies of scale global financial market (e.g., Hong Kong & Shanghai) abundant labor supply – attracts trade and FDI consumers – makes it possible to transition into domestic-oriented growth strategy
Challenges to Sustained Economic Growth • Can China sustain its growth? • Growing inequality • Social unrest • Pollution • Corruption
China and the Global Economic Crisis I. Global Uncertainty 1. Compared to the Great Depressions of the 1930s: • more sovereign actors; • more complex relationships; • the existence of functioning regional or global economic organizations; • the role of the dollar as the global currency; • greater international interactions made possible by transportation and communications revolutions
2. Differences with the 1997 Asian Financial crisis (AFC) • AFC took place within a relatively stable global environment; uncertainty limited to the region • Recovery plans could be based on familiar patterns of increasing production and selling to markets in the USA and Europe • Developed countries were indifferent to the difficulties of Asian governments
II. Global Certainties • The US and Europe are likely to remain the largest nodes in the world economy despite declining share • The growth of middle-income countries and the emergence of some low-income countries from destitution • Growing pressures on world resources, including energy, materials, and food • Increasing problems of sustainable development
III. Challenges for China • Shift external development strategy away from producing goods for existing markets toward developing new markets (especially in the middle-income countries) • Develop domestic markets, consumption and national economic infrastructure • Sustainable development • Challenges of regional re-oganization
China in the World Economy Openness of the Economy Trade to GDP ratio: 1979: 17% 1982: 22% 1994: 38% 2004: 67%
Growth in Foreign Direct Investment (FDI) • Inward FDI: annual utilized FDI about $116 billion in 2011; total accumulated FDI actually used between 1979 and 2011 were $ 1164 billion. • Increasing Chinese outward FDI: from $2.7 billion in 2002 to $56.5 billion in 2009
Trade Reform since 1978 • Development of the so-called “export-processing” trade (facilitated by the establishment of Special Economic Zones) from the old triangular (or processing trade) to regular trade (i.e., “walking on two legs”)
II. Liberalizing the Foreign Trade System • Devaluation: from 1.5 yuan to the dollar in 1980 to 3.5 yuan to the dollar by 1986 • Demonopolization of the foreign trade regime: expand the number of companies authorized to engage in foreign trade; 5,000 FTC by 1988 • Creation of a system of tariffs and non-tariff barriers • Adopted selective measures of export promotion (e.g., rebates of value-added taxes for exports; banks provided preferential interest rates to exporters; generous financing to new investment projects designed to produce exports)
China's Top Trading Partners, 2010 ($ billion) Source: PRC General Administration of Customs, China's Customs Statistics
China's Top Export Destinations, 2010 ($ billion) Source: PRC General Administration of Customs, China's Customs Statistics
China's Top Import Suppliers, 2010 ($ billion) Source: PRC General Administration of Customs, China's Customs Statistics
Composition of Chinese Trade, 2003 Source: Naughton, The Chinese Economy, 2007.
Top US Exports to China, 2010 ($ billion) *Calculated by USCBC Source: ITC
Top US Imports from China, 2010 ($ billion) *Calculated by USCBCSource: ITC
Understanding the U.S. Trade Deficit against China • The size of the bilateral trade imbalance is subject to debate (ie. The role of Hong Kong) Five Potential Explanations: • Restrictive U.S. Export Licensing? • Is China Pursuing Mercantilist Policies? • China’s Low-Wage Advantage • China’s Critical Role in Asian Production Networks • Undervaluation of the Chinese Currency
Restrictive U.S. Export Licensing? Chinese officials claim that trade imbalance would be much less if U.S. liberalized export licensing However, the Department of Commerce approved 80 percent of the total The bilateral deficit would have been reduced by only 0.3 percent if the Dept. of Commerce approved both the rejected and returned application
Is China Pursuing Mercantilist Policies? (1) Relatively modest global current account surplus 1.6% between 1993 and 2002 (2) Chinese government reduced barriers to imports -- average applied import tariffs have been reduced from 50% in 1982 to 10% in 2005; -- Import tariffs compared favorably to other major developing-country exporters applied import tariff rate in 2004: China: 10.4% India: 29.1% Mexico: 18.1% Brazil: 12.4% Indonesia: 6.9% -- Removed all licensing requirement in accession to the WTO in 2001
Is China Pursuing Mercantilist Policies?(continued) (3) Ratio of imports to GDP: from 5% in 1978 to 30% in 2005 (4) fastest growing export market for U.S. firms: U.S. exports to China rose by 160% from 2000 to 2005
China’s low wage is not necessarily the reason for the huge U.S.-China trade deficit • Productivity of a Chinese worker on average is only a small fraction that of an American • Low wages can be an advantage where labor is a larger share of total costs (shoes and apparel) but not in other sectors where wages are only 5% of the production costs (semiconductors, microprocessors etc) • Overall, productivity is more important than low wage
China’s Critical Role in Asian Production Networks • Goods that are assembled from imported parts and components now account for about 55 percent of China’s total exports and about 65 percent of the goods that China exports to the U.S. • When exported to the U.S. the entire value is counted as imports from China.
Undervaluation of Chinese currency • Until 1994, RMB was substantially overvalued • Nonetheless, undervaluation of RMB which has increased since 2002 has worsened the imbalance of bilateral trade • China’s emergence as the main point of final assembly in Asian production networks • even if U.S. global trade deficit shrinks, the U.S. may continue to have a large bilateral trade deficit with China. • U.S. policy should focus on reducing China’s global current account surplus
China- an advanced technology superstate? Engineering graduates are impressive but quality is not (one-in-ten able to compete) China’s R&D expenditure is only one-tenth that of U.S. U.S. accounts for 40 percent of global R&D expenditure Almost 90 percent of its exports of electronic and information technology products are produced by foreign companies (e.g Taiwan, South Korea)
Purchase of U.S. treasury bonds Foreign reserve $800 billion in 2005 China’s contribution to the total interest rate effect of foreign purchases of U.S. financial assets is quite small, about 20-25 points China accounts for only 15 percent of net foreign purchases of U.S. financial assets
Is China’s purchase of U.S. companies a concern? Between 2000-2004 averaged less than $50 million annually and accounted for 0.1 percent of inward direct investment It is likely to rise: Chinese companies encourages its three major international oil companies to build up secure supplies Likely to spend more on energy Two countries can work together to meet energy objectives
China and the GATT/WTO • China’s Bid for the WTO: A Chronology • 1948: Taiwan joined the GATT • 1950: the Nationalist Regime Withdrew from the GATT • 1986: Beijing submitted it’s application for GATT • Post-1989: Negotiations stalled • 1998: Following the Asian financial crisis, negotiations resumed in earnest • April 1999: Premier Zhu Rongji visited the U.S., but failed to reach an agreement • November 15, 1999: Signed the U.S.-China Agreement on WTO • September 2000: Congress approved Permanent Normal Trading Rights (PNTR) for China
II. Terms of Agreement • Agricultural tariffs: fall to 17.5% by 2004 • Average tariff on industrial products: falls to 9.4% by 2005; auto tariffs fall from 80-100% to 25% by 2006 • Financial services (banking, insurance, and securities) increased access phased in over 5 years • Telecom: ends ban on foreign investment; allows 50% ownership in internet and paging services; 49% ownership in mobile telecom, domestic and international services. • Eliminates import quotas and licensing requirements by 2005 • Grants substantial import and distribution rights to foreign corporations • Enhances IPR protection • U.S. agrees to extend China PNTR as a WTO member • China accepted the so-called “WTO-plus” commitments, including: (a) will be treated as a non-market economy (NME) in antidumping investigations for 15 years upon accession (b) transitional country-specific safeguard
III. Political and Economic Issues during the Accession negotiations • accession or resumption of membership? • the integration of a transitional economy into the liberal international economic order • Should China join the WTO as a developing country? • Taiwan
IV. Managing US.-China Trade disputes under the WTO The difficulty for the U.S. to find the “right” exporters for effective retaliation in disputes vis-à-vis China (a) the non-transparency of Chinese politics (b) most Chinese exports to the U.S. are low-end products which have many more potential consumers in the global economy and may be easily exported to alternative markets (c) the substantial share of Chinese exports generated by U.S.-based multinational corporations
China and the Trans-Pacific Partnership (TPP) • Background • Plurilateral agreement • Initiated in 2009 • In November 2011, 9 TPP countries (Australia, Brunei, Chile, Malaysia, New Zealand, Peru, Singapore, the United States, and Vietnam) announced the achievement of the broad outlines of the agreement • Possible inclusion of Japan, Canada, and Mexico into the agreement
U.S. Interests in the TPP • boost U.S. economic growth and support the creation and retention of high-quality American jobs by increasing exports to the Asia-Pacific • the U.S.’ pivot toward Asia • Move forward the trade policy agenda in light of the stalemate of the Doha Round multilateral trade negotiations and the difficulty of successfully negotiating bilateral free trade agreements (FTA) • The TPP as a high-quality, 21st century agreement covering policies on investment and government procurement, labor and environmental standards, agriculture, intellectual property, and such new sectors as state-owned and small and medium-sized enterprises
Potential Obstacles • High regulatory standards (e.g., expansive IPR requirements) • Domestic opposition (e.g., agriculture, auto, and insurance) • The need to harmonize the trade liberalization requirements with those of existing bilateral FTAs