Download
1 / 69
690 likes | 814 Vues
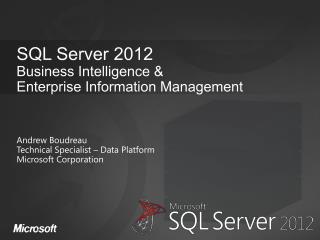
SQL Server 2012 for Business Intelligence. UTS Short Course. Mehmet Ozdemir – SA @ SSW. w: blog.ozdemir.id.au | e: mehmet @ssw.com.au | t: @ mozdemir_au. SQL Server, BI, Infrastructure Specializes in Application architecture and design SQL Performance Tuning and Optimization

E N D
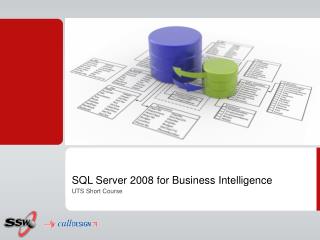
SQL Server 2012 for Business Intelligence UTS Short Course
Mehmet Ozdemir – SA @ SSW w: blog.ozdemir.id.au | e: mehmet@ssw.com.au | t: @mozdemir_au • SQL Server, BI, Infrastructure • Specializes in • Application architecture and design • SQL Performance Tuning and Optimization • HyperV, SCVMM • Technology aficionado • Virtualization • Reporting/BI • Cubes
Course Website • http://sharepoint.ssw.com.au/Training/UTSSQL/Pages/default.aspx • Course Timetable • Course Materials
Last week • Business Intelligence • Data Warehouse • Measure (Facts) • Dimension • ETL • SSIS
Homework • What is a "TYPE"? • Why? • 06_DWCreateScript.sql: What does the stored procedure "procDimDateInsert" do? • What is the difference • TRUNCATE • DELETE FROM? • SSIS: What for is the Sequence Container?
Session 2: Tonight’s Agenda • What is a Cube? • Steps in Creating a Cube • Demo: Creating a Cube • Cube Issues • Hands on Lab
Cube • Data structure for fast analysis of data • Precalculated • On top of a data warehouse • Manipulating and analysing data • from multiple perspectives
Why a cube? • Performance • Relational databases not suited for instantaneous analysis • Cube precalculates (aggregates) data
Cube Concept Groceries Electronics Product Clothing North South Garden East Geog Automotive West Q1 Q2 Q3 Q4 Time
Edges are Dimensions North South East West
Groceries North Q4
„Import“ cube example • Sum over Packages • Max over Last
Aggregate measures over time dimension • Attribute hierarchy
Why a cube? • Performance • Relational databases not suited for instantaneous analysis • Cube precalculates (aggregates) data • KPI and trending
Adventure Works example • A cube is an • “aggregation of measures against dimensions”
What is a Cube in SQL 2012 • Data Source • Where the data comes from • Adventure works connection string • Data Source View • The tables and how they link together • Orders, Details, Products and relationships • Name matching to detect relationships • Dimensions • How we break up the aggregate data • Products, Time • Measures (Facts) • The aggregate data • Line Total, Quantity
New type of Cube • SQL 2012 brings a new cube model called Tabular • Advantages • Faster • Easier to create • Disadvantages • New • Limited to the RAM on server
Steps in Creating a Cube • Define Data Source • Create Data Source View • Define Dimensions • Define Measures (Facts) • Process the Cube
Build a Cube • Review Auto Generated Cube • Check Hierarchies e.g. Product Category shows ID rather than name
Cube Issues • Keeping things Related • Dimensions should tie in to Fact tables • Use Primary Keys • Keeping things Relevant • Multiple fact tables • Even more dimensions • Keeping things Fresh • Needs to be processed • Automated SSIS Packages • Keeping Missing Data • Fails to process when keys are missing • Change missing keys to Unknown
Common Patterns • Inserting null records to prevent invalid key lookups (slows down cube processing significantly) • Cube is based off views (can be changed easily) • Can combine data using partitions
MOLAP vs ROLAP • Multidimensional Online Analytical Processing • Relational Online Analytical Processing
MOLAP ROLAP • Fast query performance • Consumes less disk space • Auto aggregation of data • Processing can be slow • Works well with large volumes of data • Real time • Securable • Slower than MOLAP • Need to create your own aggregations • Not suited for budgeting and forecasting
Best Practices - Dimensions • Consolidate multiple hierarchies into a single dimension • Avoid ROLAP storage model • Use role playing dimensions (e.g. OrderDate, BillDate, ShipDate) – avoids multiple physical copies (use a view to make it look nicer)(http://www.youtube.com/watch?v=SCH5gMCHMZs) • Avoid Many-to-Many dimensions (slow)
Best Practices – Attributes/Hierachies • Define all possible attribute relationships • Remove redundant attribute relationships • Use integer (or numeric) key columns
Best Practices - Measures • Use smallest numeric data type possible • Use semi-additive aggregate functions instead of MDX calculations to achieve same behaviour • Avoid string source column for distinct count measures
Best Practices - OLAP • No more than 20M rows per partition • Manage storage settings by usage patterns • Frequently queried => MOLAP with lots of aggregations • Periodically queries => MOLAP with less or no aggregations • Historical => ROLAP with no aggregations • Use multiple disk controllers for IO performance(Use SQLIO to determine disk perf) *
Best Practices - General • Create Perspectives to help with querying data • Create Measure Groups • Create Calculated Measures and KPIs for frequently analysed data – if you can do it in the DSV that’s preferable
MDX • MultiDimensionalEXpressions
Syntax SELECT { <Measure>,…} ON COLUMNS, { <Dimension> } ON ROWS FROM <Cube> WHERE (<Filters>)
Our data SELECT FROM [Adventure Works] WHERE [Measures].[Internet Order Count]
Slicing our data – 2007 Q1 SELECTFROM[Adventure Works]WHERE ( [Measures].[Internet Order Count], [Date].[Fiscal].[Fiscal Quarter].&[2007]&[1])
Internet Orders in 2007 Q1 2007 Q1
Slicing our data – 2007 Q1, Australia SELECTFROM[Adventure Works]WHERE ( [Measures].[Internet Order Count], [Date].[Fiscal].[Fiscal Quarter].&[2007]&[1],[Customer].[Customer Geography].[Country].&[Australia])
Internet Orders in 2007 Q1, Australia Australia 2007 Q1
Slicing our data – 2007 Q1, Australia SELECTFROM[Adventure Works]WHERE ( [Measures].[Internet Order Count], [Date].[Fiscal].[Fiscal Quarter].&[2007]&[1],[Customer].[Customer Geography].[Country].&[Australia], [Customer].[Gender].&[M])
Internet Orders in 2007 Q1, Australia, Male Australia M 2007 Q1