Download
1 / 1
10 likes | 114 Vues
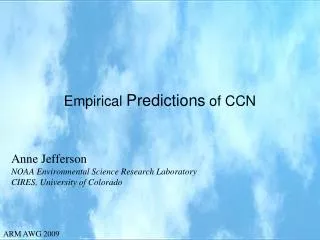
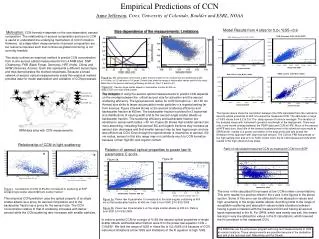
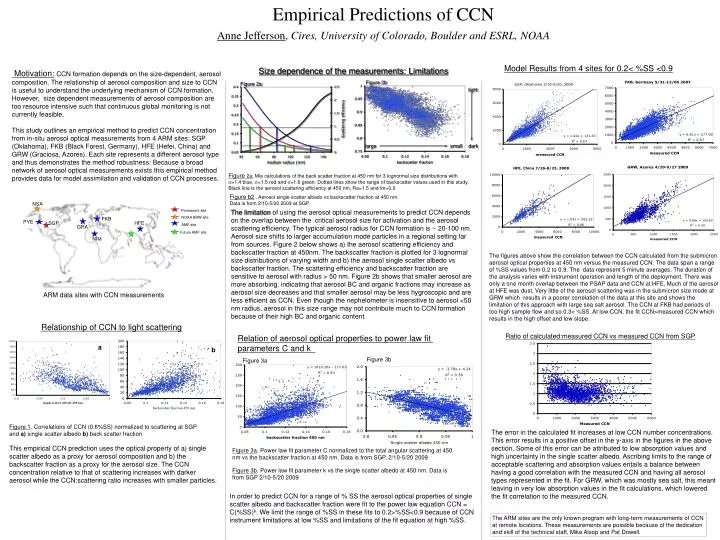
Empirical Predictions of CCN Anne Jefferson , Cires, University of Colorado, Boulder and ESRL, NOAA. Model Results from 4 sites for 0.2< %SS <0.9. light. Figure 2b. Figure 2a. large. small. dark. NSA. Permanent site. NOAA BRW site. FKB. PYE. SGP. HFE. AMF site. GRA.

E N D
Empirical Predictions of CCN Anne Jefferson, Cires, University of Colorado, Boulder and ESRL, NOAA Model Results from 4 sites for 0.2< %SS <0.9 light Figure 2b Figure 2a large small dark NSA Permanent site NOAA BRW site FKB PYE SGP HFE AMF site GRA Future AMF site NIM Relationship of CCN to light scattering a b Size dependence of the measurements: Limitations Motivation:CCN formation depends on the size-dependent, aerosol composition. The relationship of aerosol composition and size to CCN is useful to understand the underlying mechanism of CCN formation. However, size dependent measurements of aerosol composition are too resource intensive such that continuous global monitoring is not currently feasible. This study outlines an empirical method to predict CCN concentration from in-situ aerosol optical measurements from 4 ARM sites: SGP (Oklahoma), FKB (Black Forest, Germany), HFE (Hefei, China) and GRW (Graciosa, Azores). Each site represents a different aerosol type and thus demonstrates the method robustness. Because a broad network of aerosol optical measurements exists this empirical method provides data for model assimilation and validation of CCN processes. Figure 2a. Mie calculations of the back scatter fraction at 450 nm for 3 lognormal size distributions with =1.4 blue, =1.5 red and =1.6 green. Dotted lines show the range of backscatter values used in this study. Black line is the aerosol scattering efficiency at 450 nm, Re=1.5 and Im=0.0 Figure b2 . Aerosol single scatter albedo vs backscatter fraction at 450 nm. Data is from 2/10-5/20 2009 at SGP. The limitation of using the aerosol optical measurements to predict CCN depends on the overlap between the critical aerosol size for activation and the aerosol scattering efficiency. The typical aerosol radius for CCN formation is ~ 20-100 nm. Aerosol size shifts to larger accumulation mode particles in a regional setting far from sources. Figure 2 below shows a) the aerosol scattering efficiency and backscatter fraction at 450nm. The backscatter fraction is plotted for 3 lognormal size distributions of varying width and b) the aerosol single scatter albedo vs backscatter fraction. The scattering efficiency and backscatter fraction are sensitive to aerosol with radius > 50 nm. Figure 2b shows that smaller aerosol are more absorbing, indicating that aerosol BC and organic fractions may increase as aerosol size decreases and that smaller aerosol may be less hygroscopic and are less efficient as CCN. Even though the nephelometer is insensitive to aerosol <50 nm radius, aerosol in this size range may not contribute much to CCN formation because of their high BC and organic content. The figures above show the correlation between the CCN calculated from the submicron aerosol optical properties at 450 nm versus the measured CCN. The data span a range of %SS values from 0.2 to 0.9. The data represent 5 minute averages. The duration of the analysis varies with instrument operation and length of the deployment. There was only a one month overlap between the PSAP data and CCN at HFE.Much of the aerosol at HFE was dust.Very little of the aerosol scattering was in the submicron size mode at GRW which results in a poorer correlation of the data at this site and shows the limitation of this approach with large sea salt aerosol. The CCN at FKB had periods of too high sample flow and so 0.3< %SS. At low CCN, the fit CCN>measured CCN which results in the high offset and low slope. ARM data sites with CCN measurements Ratio of calculated:measured CCN vs measured CCN from SGP Relation of aerosol optical properties to power law fit parameters C and k Figure 3b Figure 3a Figure 1. Correlations of CCN (0.6%SS) normalized to scattering at SGP and a) single scatter albedo b) back scatter fraction This empirical CCN prediction uses the optical property of a) single scatter albedo as a proxy for aerosol composition and b) the backscatter fraction as a proxy for the aerosol size. The CCN concentration relative to that of scattering increases with darker aerosol while the CCN:scattering ratio increases with smaller particles. The error in the calculated fit increases at low CCN number concentrations. This error results in a positive offset in the y-axis in the figures in the above section. Some of this error can be attributed to low absorption values and high uncertainty in the single scatter albedo. Ascribing limits to the range of acceptable scattering and absorption values entails a balance between having a good correlation with the measured CCN and having all aerosol types represented in the fit. For GRW, which was mostly sea salt, this meant leaving in very low absorption values in the fit calculations, which lowered the fit correlation to the measured CCN. Figure 3a. Power law fit parameter C normalized to the total angular scattering at 450 nm vs the backscatter fraction at 450 nm. Data is from SGP, 2/10-5/20 2009 Figure 3b. Power law fit parameter k vs the single scatter albedo at 450 nm. Data is from SGP 2/10-5/20 2009 In order to predict CCN for a range of % SS the aerosol optical properties of single scatter albedo and backscatter fraction were fit to the power law equation CCN = C(%SS)k. We limit the range of %SS in these fits to 0.2>%SS<0.9 because of CCN instrument limitations at low %SS and limitations of the fit equation at high %SS. The ARM sites are the only known program with long-term measurements of CCN at remote locations. These measurements are possible because of the dedication and skill of the technical staff, Mike Alsop and Pat Dowell.