Download

1 / 45
450 likes | 568 Vues
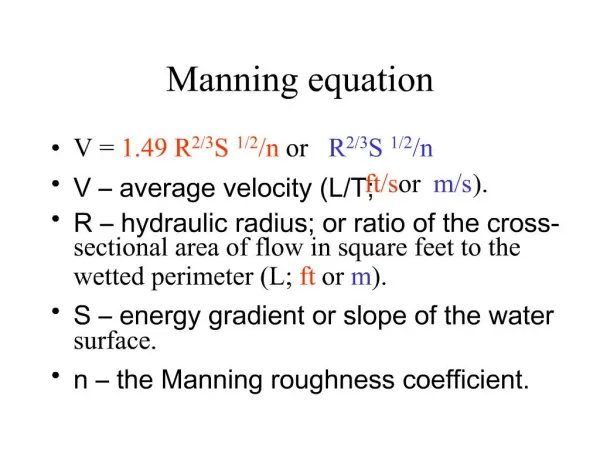
opportunity benefit – opportunity cost net utility. Decision Equation. satisfaction. regret. net utility. The buyer determines the value of an item!. Economic Principles. subjective value = worth determined by the buyer

E N D
opportunity benefit – opportunity cost net utility Decision Equation satisfaction regret net utility
Economic Principles • subjective value =worth determined by the buyer • diminishing marginal utility =receiving less additional satisfaction as more is obtained during specific time period
Diminishing Marginal Utility • “receive less and less” = diminishing • “additional” = marginal • “satisfaction” = utility • “specific period of time” = time limit
15 12 9 6 3 1 2 3 4 5 6 7 8 9 10 total satisfaction marginal utility # of candy bars 0
price tag personal value personal value price tag personal value price tag Function of Prices
Prices • transmit information • provide incentives • redistribute income
Gasoline Sales Components • crude oil suppliers • refiners • distribution and marketing (stations) • consumers
consumers demand more stations buy larger quantities refiners increase production suppliers increase output
value= determined by buyer price= determined by buyer & seller • supply and demand
demand act of buying
Law of Demand All else being constant, the lower the price charged for a good or service, the greater the quantity people will demand and vice versa.
Fred Jonna Josh Robert Sarah Ashleigh Bethany ACTUAL PRICE .82 .72 .58 .43 1.15 .68 .61 .70
Fred Jonna Josh Robert Sarah Ashleigh Bethany ACTUAL PRICE .82 .72 .58 .43 1.15 .68 .61 .60
demand schedules table listings of various quantities demanded at various prices
demand curve line-graph of demand schedule information
1.30 1.20 price per bar 1.10 1.00 Demand Curve .90 .80 .70 .60 quantity .50 4000 5000 2000 8000 1000 3000 6000 7000
inelastic demand quantity is less responsive to the price
$60 $55 price per unit $50 Vertical Curve $45 $40 $35 $30 $25 quantity $20 2750 3000 1250 3750 1000 2500 3250 3500
elastic demand quantity increases while the price remains the same
$50 $45 price per unit $40 Horizontal Curve $35 $30 $25 $20 $15 quantity $10 4 5 2 8 1 3 6 7
Giffen Goods quantity increases as the price increases
$90 $80 price per unit $70 $60 Giffen Curve $50 $40 $30 $20 quantity $10 400 500 200 700 300 100 600
Review negatively sloping curves • normal demand curve • quantity increases as price decreases
Review positively sloping curves • Giffen goods (“snob appeal”) • quantity increases as price increases
Review vertical curve • inelastic demand • quantity remains the same even if price increases
Review horizontal curve • elastic demand • price remains the same even if quantity increases
change in quantity demanded a change in price causes a change in numbers demanded
1.30 1.20 1.20 Change in Quantity Demanded price per bar 1.10 1.00 .90 .80 .70 .70 .60 quantity .50 4000 5000 2000 8000 1000 3000 6000 7000
increase in demand demanding more at every price
1.30 1.20 1.10 1.00 Increase in Demand .90 .80 .70 .60 .50 4000 5000 2000 8000 1000 3000 6000 7000
decrease in demand demanding less at every price
1.30 1.20 1.10 1.00 Decrease in Demand .90 .80 .70 .60 .50 4000 5000 2000 8000 1000 3000 6000 7000
Review change in quantity demanded change in demand • caused by a price change • caused by a demand change • moves along the same curve • shifts the whole curve
Change in Demand Factors • change in people’s income • change in price of related goods • change in people’s tastes and preferences • change in people’s expectations
$50 $45 $40 $35 $30 $25 $20 $15 $10 4 5 2 1 3 6
normal good demand increases because buyer’s income increases
inferior goods • demand decreases because buyer’s income increases • demand increases because buyer’s income decreases
substitute goods goods that may be used in place of others
Substitute Goods P2 P1 Q2 Q2 Q1
complementary goods goods usually purchased together
5.70 5.10 Complementary Goods 4.50 3.90 2.70 2.10 1.50 .90 .30 Q2 Q1
fad items goods and services that appear quickly on the scene, are advertised heavily, and are sold in great quantities over a short period of time
Expectations • demand shifts due to anticipation of dramatic rise or fall of the price of a good • influenced by: ~price changes ~advertisements ~weather changes