Download
1 / 25
250 likes | 405 Vues
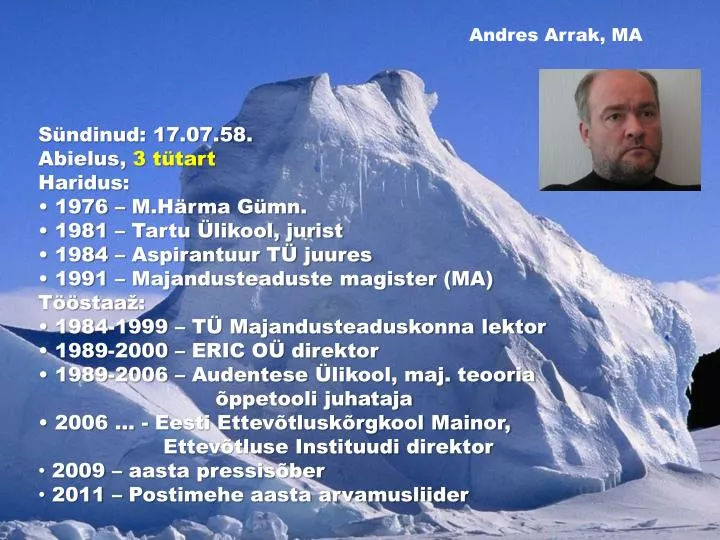
Andres Arrak, MA. Sündinud: 17.07.58. Abielus, 3 tütart Haridus: 1976 – M.Härma Gümn . 1981 – Tartu Ülikool, jurist 1984 – Aspirantuur TÜ juures 1991 – Majandusteaduste magister (MA) Tööstaa ž : 1984-1999 – TÜ Majandusteaduskonna lektor 1989-2000 – ERIC OÜ direktor

E N D
Andres Arrak, MA • Sündinud: 17.07.58. • Abielus, 3 tütart • Haridus: • 1976 – M.HärmaGümn. • 1981 – Tartu Ülikool, jurist • 1984 – Aspirantuur TÜ juures • 1991 – Majandusteaduste magister (MA) • Tööstaaž: • 1984-1999 – TÜ Majandusteaduskonna lektor • 1989-2000 – ERIC OÜ direktor • 1989-2006 – Audentese Ülikool, maj. teooria • õppetooli juhataja • 2006 … - Eesti Ettevõtluskõrgkool Mainor, • Ettevõtluse Instituudi direktor • 2009 – aasta pressisõber • 2011 – Postimehe aasta arvamusliider
EEKK õppekeskused Käivitub sügis 2012 Jõhvi Nõmme G (50) Keila G EraG ÜhisG Täisk G Paalalinna G Hansa G Kuress. G Abja G
Ettevõtlus GÜMNAASIUMIDELE August, 2011 Mainori Kõrgkool Tartu Ülikool Tallinna Tehnikaülikool Maaülikool
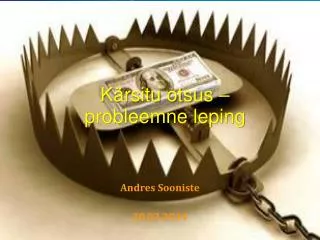
Kas õnn peitub rahas? ? Andres Arrak Eesti Ettevõtluskõrgkool Mainor ettevõtluse instituut EEKK ettevõtluspäev Tartus 19. aprill 2011
Notsu: “Kuule Puhh, aga äkki see puu kukub meile kaela ….. ?”
Eesti SKP kvartaalne reaalkasv 15,0 10,0 5,0 0,0 - 5,0 - 10,0 - 15,0 - 20,0 III III III III III III III III III III III III III III III III III 94'I 95'I 96'I 97'I 98'I 99'I 00'I 01'I 02'I 03'I 04'I 05'I 06'I 07'I 08'I 09'I 10'I
GLOBAALNE MAJANDUS- LANGUS 11,4 12,0 10,5 10,5 10,0 8,1 8,0 7,9 7,3 8,0 7,1 6,5 5,5 6,0 4,3 4,3 Eesti SKP aastane reaalkasv 4,0 EESTI MAJ.POL. MUDEL 2,0 0,0 0,0 -1,5 -1,6 -2,0 Ühinemine EL’ga: 1. uued turud, 2. madal %, 3. laenude ja kinnisvaraturu tõus, 4. kasvav tööjõu puudus. -4,0 Venemaa kriis Kagu-Aasia finantskriis -6,0 -6,5 INVESTEERINGUTE MAKSUVABASTUS PROP. TULUMAKS VALUUTAKOMITEE -8,0 -8,8 -10,0 -12,0 POLNUD MEIE SÜÜ GLOBAALNE MAJANDUS- LANGUS GLOBAALNE FINANTS- KRIIS -14,0 -13,6 -14,2 -16,0 2005 2006 2007 2008 2009 2010 1990 1991 1992 1993 1994 1995 1996 1997 1998 1999 2000 2001 2002 2003 2004
11,4 12,0 10,5 10,5 10,0 8,1 8,0 7,9 7,3 8,0 7,1 6,5 5,5 6,0 4,5 4,3 4,3 4,0 2,3 2,0 0,0 0,0 Isitover? - 2,0 - 1,5 - 1,6 - 4,0 - 6,0 - 6,5 - 8,0 - 8,8 - 10,0 - 12,0 - 14,0 - 13,6 - 14,1 - 14,2 - 16,0
Kas klaas on pooltäis … ? Q Q* POTENTSIAALNE SKT (Q*) TEGELIK SKT (Q) Eesmärk ei ole tsüklist lahti saamine vaid selle ennustamine, stabiliseerimine ja sotsiaal- majanduslike tagajärgede leevendamine
Q Tüüpiline KLASSIKALINE lähenemine Q* POTENTSIAALNE SKT (Q*) {Q<Q*} VALITSUS PEAB AKTIIVSELT SEKKUMA VALITSUS PEAB TAGASI TÕMBUMA TEGELIK SKT (Q) Tüüpiline KEINSISTLIK lähenemine Aeg … või on klaas pooltühi ? Vale prognoos {Q=Q*} eelarvedefitsiit (DISKREETNE/PAINDLIK MAJANDUSPOLIITIKA) Keinsistid: “lühiajalised” pessimistid Klassikud: “pikaajalised” optimistid
Kes on rikkaim maailmas? GDP percapita (PPP) 2010, intl. $ Allikas: CIA WorldFactbook 1. Qatar 145 300 2. Liechtenstein 122 100 3. Luxembourg 81 800 ― Bermuda 69 900 4. Singapore 62 200 5. Norway 59 100 ― Jersey 57 000 6. Kuwait 51 700 7. Brunei 50 300 8. USA 47 400 ― H Kong 45 600 9. Andorra 44 900 10. Switzerland 42 900 11. San Marino 41 900 12. Australia 41 300 13. Netherlands 40 500 14. Bahrain 40 400 15. Austria 40 300 16. UAE 40 200 17. Canada 39 600 18. Sweden 39 000 19. Iceland 38 400 20. Belgium 37 900 21. Eq. Guinea 37 900 22. Ireland 37 600 23. Denmark 37 000 24. Germany 35 900 25. Finland 35 300 26. UK 35 100 27. Taiwan 35 100 28. Japan 34 200 29. France 33 300 30. Italy 30 700 49. Estonia 19 000 54. Lithuania 15 900 55. Russia 15 900 60. Latvia 14 500 101. China 7 400 Kas elu Eestis on 4× halvem kui Luksemburgis?
Kõik on suhteline SKP elaniku kohta, OVP (EU15=100), 1980-2010 Whither growth in central andeasternEurope? Policy lessons for an integratedEurope Bruegel 2010.http://www.bruegel.org/pdf-download/?pdf=uploads/tx_btbbreugel/101124_bp_zd_whither_growth.pdf
Kus on parim elada? HumanDevelopmentIndex 2010 Allikas: HumanDevelopmentReport 2010 1. Norway 0,938 2. Australia 0,937 3. New Zealand 0,907 4. USA 0,902 5. Ireland 0,895 6. Liechtenstein 0,891 7. Netherlands 0,890 8. Canada 0,888 9. Sweden 0,885 10. Germany 0,885 11. Japan 0,884 12. Korea R 0,877 13. Switzerland 0,874 14. France 0,872 15. Israel 0,872 16. Finland 0,871 17. Iceland 0,869 18. Belgium 0,867 19. Denmark 0,866 20. Spain 0,863 21. H Kong 0,862 22. Greece 0,855 23. Italy 0,854 24. Luxembourg 0,852 25. Austria 0,851 26. UK 0,849 27. Singapore 0,846 28. Czech R 0,841 29. Slovenia 0,828 30. Andorra 0,824 31. Slovakia 0,818 32. UAE 0,815 33. Malta 0,815 34. Estonia 0,812 44. Lithuania 0,783 48. Latvia 0,769 65. Russia 0,719 169. Zimbabwe 0,140
NORWAY HumanDevelopment Index 2003 IRELAND 0,95 USA FINLAND 0,9 ESTONIA LITHUANIA 0,85 LATVIA 0,8 PPP GDP percapita 2003 CHINA TURKEY 0,75 0 5000 10000 15000 20000 25000 30000 35000 40000
Õnn ei peitu rahas! Happiness is a mental state of well-being characterized by positive emotions ranging from contentment to intense joy.
… küll aga õnnetus raha puudumises?
Õnne indeks! SatisfactionwithLifeIndex 2006 Index was created by Adrian G. White, an Analytic Social Psychologist at the University of Leicester 1. Denmark 273,5 2. Switzerland 273,3 3. Austria 260,0 4. Iceland 260,0 5. Bahama 256,7 6. Finland 256,7 7. Sweden 256,7 8. Bhutan 253,3 9. Brunei 253,3 10. Canada 253,3 11. Ireland 253,3 12. Luxembourg 253,3 13. C Rica 250,0 14. Malta 250,0 15. Netherlands 250,0 16. Ant-Barbuda 246,7 17. Malaysia 246,7 18. N Zealand 246,7 19. Norway 246,7 20. Seychelles 246,7 21. St Kitts Nevis 246,7 22. UAE 246,7 23. USA 246,7 35. Germany 240,0 41. UK 236,7 46. Spain 233,3 50. Italy 230,0 62. France 220,0 67. Slovenia 220,0 82. China 210,0 84. Greece 210,0 90. Japan 206,7 107. Hungary 190,0 108. Libya 190,0 125. India 180,0 139. Estonia 170,0 154. Latvia 156,7 155. Lithuania 156,7 177. Zimbabwe 110,0
Tänan! Puhh: “… aga äkki ei kuku!” andres.arrak@gmail.com