Download
1 / 9
90 likes | 251 Vues
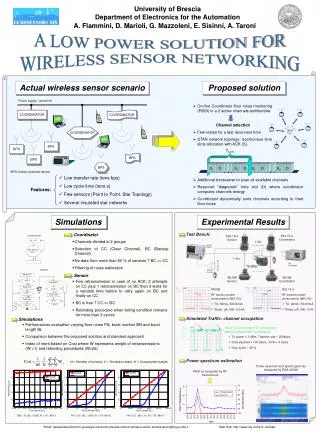
Hydraulic simulations. Model used HEC-RAS 4.0b 1D model Boundary conditions Upper: Discharge hydrograph Lower: Constant sea levels [N 60 + 0.50…2.50 m] Water elevations to Excel (numeric results) and ArcGIS (graphic results) Output interval: 12 hours (enough?).

E N D
Hydraulic simulations • Model used • HEC-RAS 4.0b • 1D model • Boundary conditions • Upper: Discharge hydrograph • Lower: Constant sea levels [N60+ 0.50…2.50 m] • Water elevations to Excel (numeric results) and ArcGIS (graphic results) • Output interval: 12 hours (enough?)
Maximum difference: 0.12 m. Luotsimäenhaara Raumanjuopa
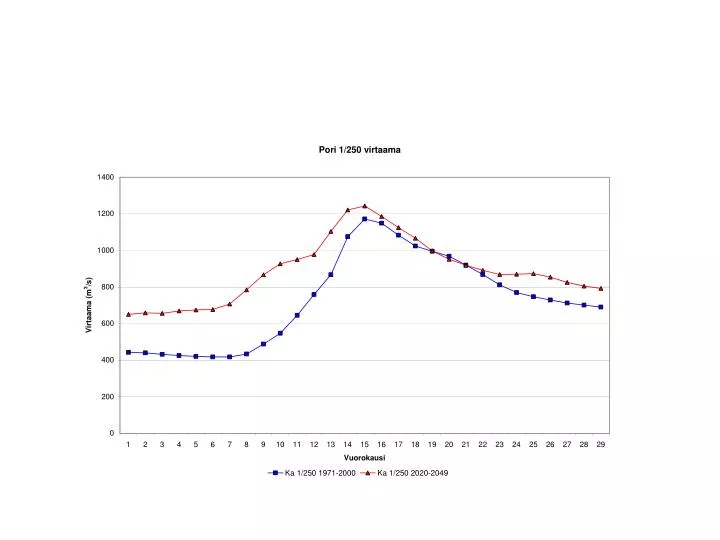
Initial conditions [650 m³/s, 1.50 m] Maximum water level [1243 m³/s, 1.50 m]
Suggestion for output of results • Simulations for discharge-sea level –scenarios • HQ 250, 100, 50, 30 • N60+ 0.5, 1.0, 1.5, 2.0 m • Water levels in main reach cross sections in every 12 hours • Top levels of embankments included in the results • Comments, suggestions? Shall I calculate the rest of the scenariosand deliver the results to VATT?