Download
1 / 36
360 likes | 541 Vues
The Elecrocardiogram (ECG). By Dr. Maha Alenazy. Points of Discussion . What is ECG? How to preform ECG? Interpretation of ECG results: waves and segments Their clinical applications Some ECG abnormalities HR How to calculate Cardiac axis .

E N D
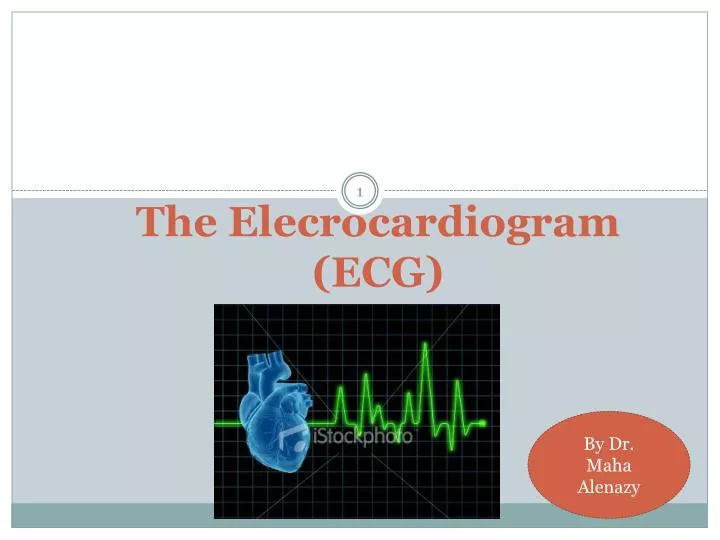
The Elecrocardiogram (ECG) By Dr. MahaAlenazy
Points of Discussion What is ECG? How to preform ECG? Interpretation of ECG results: waves and segments Their clinical applications Some ECG abnormalities HR How to calculate Cardiac axis
Learn basics of ECG to interpret results for clinical significance.
What is ECG? ECG = electro + cardio + graphy. A recording of the electrical activity of the heart. Cardiac impulse passes through the heart forming an electrical current spreading in the surrounding tissue which in turn generate electrical potentials. ECG measures the differences in these electrical potentials.
Why Is The ECG Important? • It is a widely used & useful investigation in medicine. • Used for: • Identification of cardiac rhythm disturbances. • Diagnosis of cardiac disorders e.g. MI. • Generalized disorders that affect the body e.g. electrolyte disturbances.
How is the ECG recorded? It is recorded by electrodes placed on the surface of the body. The electrocardiograph (the ECG machine) measures the potential differences between the electrodes and records them. The arrangement of a pair of electrodes constitute a lead.
ECG Leads • Limb leads: • I • II • III • Augmented limb leads: • (aVR, aVL, aVF). • Chest leads: • (V1-V6).
Where are The Electrodes Placed? RA LA Lead I + - - - Lead II Lead III LL + + • Bipolar limb leads: • Lead I • Lead II • Lead III • Electrodes placed on: • Left arm (LA). • Right arm (RA). • Left leg/foot (LL). • Einthoven's triangle
Cont. Placement of electrodes RA LA aVR aVL + + aVF + LL • Unipolar leads: • Augmented limb leads: • aVR • aVL • aVF • Electrodes placed: • Position is the same as bipolar limb leads.
Cont. Placement of electrodes • Unipolar leads: • Chest leads: • V1: Rtsternal edge, 4th ICS. • V2: Lt sternal edge, 4th ICS. • V3: ½ between V2 & V4. • V4: apex. • V5: anterior axillary line. • V6: mid-axillary line.
The standard 12-lead ECG • How many electrodes? • 10 electrodes • How many leads? • 12 leads
Why 12 leads? • Lead = view • 12 views of the heart: • From the frontal plane: • Limb leads. • Augmented limb leads. • From the horizontal plane: • Chest leads.
Components of the normal ECG recording P wave: Atrial depolarization (at beginning of aterial contraction) QRS complex: Ventricular depolarization (at beginning of ventricular contraction) T wave: Ventricular repolarization (before relaxation of ventricules) U wave: Repolarization of the Purkinjie fibers. Seen in slower HR
ECG paper Calibrations One small square= 0.04 Sec 5 small seq= 1 big seq = 0.2 Sec 5 large seq = 1 Sec 0.04 sec = 1mm 1 sec = 25mm Paper speed : 25mm/sec 1mV=10mm
Durations of ECG Parts P wave : Duration: (0.08-0.11 sec). Height: no more than 2.5mm PR interval: Measured from the beginning of the P wave to the beginning of the QRS complex. Duration: 0.12-0.20 sec (count little sequares from beginning of the P wave to the beginning of the QRS complexand multiply by 0.04) Physio: decrease: kids (bcus faster heart rate) increase with elderly (bcus slower heart rate) PR Segment: From End of P wave to Beginning to QRS. Isoelectric (parallel t ST segment). His-purkinjie activated.
Abnormalities P WAVE PR Interval If taller/pointed or wider than normal, this may indicate: COPD CHF valvular disease Aterial enlargement Inverted P wave: ectopic P wave in AV junction. Long PR interval (+0.20sec): impluse is delayed through ateria or AV node as in: 1st degree HB Hypothyroidism Digitalis toxicity Short PR interval (- 0.12): ectopic pacemaker.
QRS complex: Measured from beginning of deflection from baseline until return to baseline. Duration: 0.06-0.10 sec (men more…may get 0.11 sec). ST segment: End of QRS until beginning of T wave. Isoelectric. Important clinically. T Wave: (0.5mm-5mm) in height in limb leads. QT Interval: (age, gender, HR) Less than half of RR interval is normal, same as half of RR interval is borderline, while more is prolonged.
Abnormalities QRS: Ectopic pace maker can cause longer QRS (more than 0.12…around 0.16 or more). Enlargement of right Ventricle causes abnormal large R wave while enlargement of the left ventricle causes abnormally prominent S wave.
Cont. Abnormalities ST segment: Depression: Myocardial ischemia or Hypokalemia, digitalis. Elevation: Myocardial injury, pericarditis, ventricular aneurysm T wave: If opposite to QRS and –ve: MI Tall and peaked: hyperkalemia Inverted: Cereberal.
U Wave Average height is 0.33mm. If taller than 1.5mm: electrolyte imbalance (hypokalemia, hypomagnesemia, hypercalcemia), medications (digitlalis, etc), hyperthyrodisim, NS disease. -ve U wave: heart disease such as ischemic heart disease.
Heart Rhythm R R • Rhythm: • Regular = equal R-R intervals. • Irregular = Unequal R-R intervals
Heart Rate Calculation R R 1500 R-R interval (#small sq.) 300 R-R interval (big sq.) • Heart Rate: • Regular rhythm: HR= OR HR =
Cont. HR calculation • Irregular rhythm: • Count number of QRS complexes in 30 big sq. = no. of QRS in 6 seconds. • Multiply by 10.
Heart Rate Normal = 60-100 bpm (beats per minute). < 60 bpm = bradycardia. > 100 bpm = tachycardia. Sinus Arrhythmia: occurs when SA node discharges irregularly. If associated with respiration changes, it is called respiratory sinus arrhythmia. Inspiration causes HR is up, R-R shortens. Opposite in expiration.
Heart Block (AV Block) May occur at the AV node, Bundle of His, r Purkinjie fibers. PR interval duration is used to determine the type of HB QRS width is used to assess the level of location of the block
1st degree heart Block Impulses from SA node to the ventricles are delayed. At AV node. : Prolonged PR interval (more than 0.20sec) proceeding every QRS by same distance indicates 1st degree AV block) Maybe normal in athletes. Hyperkalemia, inferior wall MI, rheumatic heart disease, digitalis etc.
2nd degree heart blocks: Atrial impulses are blocked frm ventricles. are characterized by dropped beats (missing QRS). Depending on location: type I and Type II Type I. At AV node: longer and longer resulting in strengthening PR interval across ECG. QRS is 0.10 sec r less: right coronary artery occlusion. Type II: at bundle of His or bundle branches. PR interval appears within normal or slightly prolonged. QRS narrow or more than 0.10 in duration: acute myocarditis.
In 3rd degree heart block, there is variable PR intervals with no apparent relationship between P wave and QRS complexes. No True PR interval QRS duration is variable. e.g. MI
Cardiac Axis • What is cardiac axis? The sum (average) of all the individual vectors occurring sequentially during depolarization of the ventricles. • It represents the net depolarization through the myocardium and is worked out using the limb leads, in particular leads I and III. The directions of each of these leads is called the cardiac vector • By convention, the direction of lead I is 0; and III points down.
Calculate the net deflection of each lead – e.g. in lead I, if there is a S wave measuring three small squares and an R wave height of six small squares, the net deflection is +3. Do this for leads I and III A net positive deflection goes in the direction of the vector; negative deflections go in the opposite direction of the vector – e.g. net deflection of +3 in I goes 3points in the direction of I; a net deflection of e.g -5 in III goes in the opposite deflection of the vector (i.e. upwards) by 5 points.
Cont. The cardiac vector is therefore the sum of the individual vectors from I and III –
Causes Of Abnormal Axis Left Axis deviation: Normal variation (physiologic, often with age) Mechanical shifts, (pregnancy, ascites, abdominal tumor) Left ventricular hypertrophy Left bundle branch block Congenital heart disease (e.g. atrial septal defect) Emphysema Hyperkalemia Ventricular ectopic rhythms Inferior myocardial infarction Right Axis Deviation: Right ventricular hypertrophy Right bundle branch block Dextrocardia Ventricular ectopic rhythms Lateral wall myocardial infarction Right ventricular load, for example Pulmonary Embolism or COPD