Download
1 / 11
110 likes | 229 Vues
BMP6(206176_at). BMPR2(225144_at). ACVR2A(205327_at). Exprs 0 2 4 6 8 10 12. Exprs 0 2 4 6 8 10 12. Exprs 0 2 4 6 8 10 12.

E N D
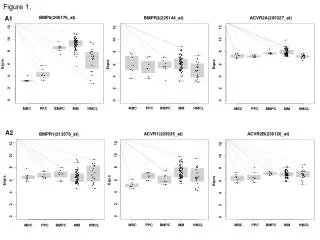
BMP6(206176_at) BMPR2(225144_at) ACVR2A(205327_at) Exprs 0 2 4 6 8 10 12 Exprs 0 2 4 6 8 10 12 Exprs 0 2 4 6 8 10 12 MBC PPC BMPC MM HMCL MBC PPC BMPC MM HMCL MBC PPC BMPC MM HMCL ACVR1(203935_at) ACVR2B(236126_at) BMPR1(213578_at) Exprs 0 2 4 6 8 10 12 Exprs 0 2 4 6 8 10 12 Exprs 0 2 4 6 8 10 12 MBC PPC BMPC MM HMCL MBC PPC BMPC MM HMCL MBC PPC BMPC MM HMCL Figure 1. A1 A2
SMAD4(202527_at) SMAD1(210993_at) SMAD5(225219_at) Exprs 0 2 4 6 8 10 12 14 Exprs 0 2 4 6 8 10 12 14 Exprs 0 2 4 6 8 10 12 14 MBC PPC BMPC MM HMCL MBC PPC BMPC MM HMCL MBC PPC BMPC MM HMCL Figure 1. A3
Figure 1. BMP6 BMP6 BMP6 BMP6 stimulation phosho-SMAD1,-5,-8 phosho-SMAD2 BMP6 Actin B1 B2 B3 XG-10 XG-11 U266 B4 C pMMC SKMM2
Figure 2. + BMP6 Co + BMP6 + heparin U266 BMP6
Figure 3. XG-1 XG-19 XG-11 U266 0.0 0.2 0.4 0.6 0.8 1.0 0.0 0.2 0.4 0.6 0.8 1.0 0.0 0.2 0.4 0.6 0.8 1.0 0.0 0.2 0.4 0.6 0.8 1.0 1.2 4 4 4 4 4 4 4 4 4 4 0 0 0 0 0 0 0 0 0 0 .00128 .00128 .00128 .00128 .00128 .00128 .00128 .00128 .00128 .00128 .8 .8 .8 .8 .8 .8 .8 .8 .8 .8 .0064 .0064 .0064 .0064 .0064 .0064 .0064 .0064 .0064 .0064 .032 .032 .032 .032 .032 .032 .032 .032 .032 .032 .16 .16 .16 .16 .16 .16 .16 .16 .16 .16 SKMM-2 OPM-2 LP-1 0.0 0.2 0.4 0.6 0.8 1.0 0.0 0.2 0.4 0.6 0.8 1.0 0.0 0.2 0.4 0.6 0.8 1.0 1.0 1.4 XG-13 XG-10 RPMI-8226 0.0 0. 0.4 0.6 0.8 1.0 1.2 0.0 0.2 0.4 0.6 0.8 1.0 0.0 0.2 0.4 0.6 0.8 1.0 1.2 A 3H-uptake BMP6-concentration (µg/ml)
Figure 3. 6.6% 6.7 % 7.2 % 8.0 % 7.5 % 5.5 % 6.3 % 6.1 % 14.0 % 25.5 % 12.2 % 38.5 % 8.0 % 5.7 % 5.7 % 48 h 72 h 24 h 8 h B medium control medium control + heparin count BMP6 38.5 % BMP6 + heparin 7.1 % 8.0 % annexin V-FITC
Figure 3. pMMC 2 pMMC 3 pMMC 1 * * * * * * Fraction of non-apoptotic MMC * * * * * * * BMP6-concentration (µg/ml) BMP6 stimulation Cleaved Caspase-8 Cleaved Caspase-9 Actin C D SKMM-2
Figure 3. Noggin Noggin + 1 µg/ml BMP6 * 0.0 0.5 1.0 1.5 2.0 0.0 0.5 1.0 1.5 0 .032 .16 .8 4 20 0 BMP6 .032 .16 .8 4 20 Sclerostin Sclerostin + 1 µg/ml BMP6 * * * * 0.0 0.5 1.0 1.5 2.0 2.5 0.0 0.5 1.0 1.5 2.0 2.5 0 BMP6 .032 .16 .8 4 20 0 .032 .16 .8 4 20 E 3H-uptake Inhibitor-concentration (µg/ml)
Figure 4. 0.1 0.2 0.3 0.4 0.5 0.6 tubule development positive negative 4 0.8 0.16 0.032 medium BMP6-concentration (µg/ml) A Medium control Positive control Negative control 0.16 µg/ml 0.032 µg/ml 0.8 µg/ml 4 µg/ml B
Figure 5. OS HM-group BMP6high BMP6high BMP6high BMP6high P=.02 BMP6low BMP6low BMP6low BMP6low EFS LR-group EFS HM-group A OS LR-group P=.03 B
Figure 5. EFS OS P=.03 WBM-BMP6high WBM-BMP6high WBM-BMP6low WBM-BMP6low C


