Download
1 / 18
180 likes | 331 Vues
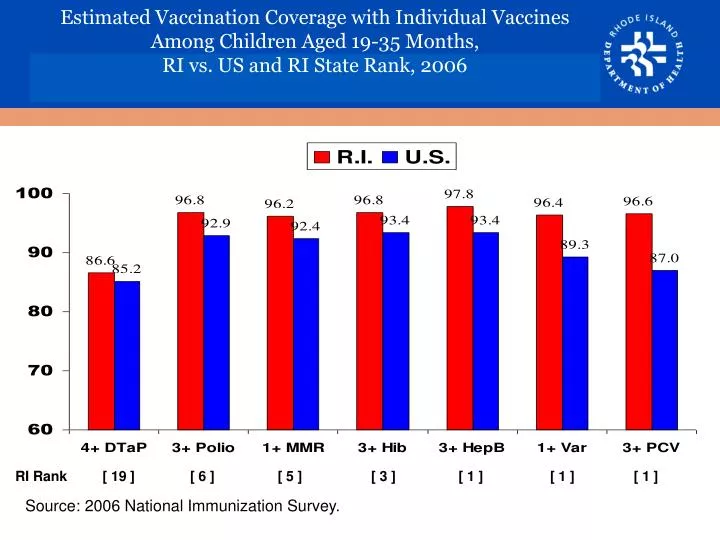
Estimated Vaccination Coverage with Individual Vaccines Among Children Aged 19-35 Months, RI vs. US and RI State Rank, 2006. RI Rank [ 19 ] [ 6 ] [ 5 ] [ 3 ] [ 1 ] [ 1 ] [ 1 ]. Source: 2006 National Immunization Survey. .

E N D
Estimated Vaccination Coverage with Individual Vaccines Among Children Aged 19-35 Months, RI vs. US and RI State Rank, 2006 RI Rank [ 19 ] [ 6 ] [ 5 ] [ 3 ] [ 1 ] [ 1 ] [ 1 ] Source: 2006 National Immunization Survey.
Selected Vaccination Series Coverage Among Children Aged 19-35 Months,RI vs. US and RI State Rank, 2006 RI Rank [ 28 ] [ 17 ] [ 7 ] * 4+DTaP/DTP, 3+Polio, 1+MCV, and 3+Hib. ** 4+DTaP/DTP, 3+Polio, 1+MCV, 3+Hib, and 3+HepB. *** 4+DTaP/DTP, 3+Polio, 1+MCV, 3+Hib, 3+HepB, and 1+Varicella. Source:2006 National Immunization Survey.
4:3:1:3:3:1 Series Coverage RatesAmong Rhode Island Children 19-35 Months of AgeBy Selected Characteristics Source: 2005-2006 National Immunization Survey
Data Source: 2005-2006 NIS • The 2005 and 2006 NIS data were combined to improve the precision of estimate of vaccination coverage for sub-group analyses. • For accurate coverage estimates, the provider report of vaccinations received by the child was used to produce vaccination coverage rates (The household report of vaccination was not used to produce coverage rates). • Total sample size used for this analysis was 570 children who had adequate provider data (n=267 for 2005 and n=303 for 2006).
4:3:1:3:3:1 Series Coverage Rate by Child AgeRhode Island, 2005-2006 Percent Source: 2005-2006 National Immunization Survey
4:3:1:3:3:1 Series Coverage Rate by Child Ever Received WIC Benefits Rhode Island, 2005-2006 Percent Source: 2005-2006 National Immunization Survey
4:3:1:3:3:1 Series Coverage Rate by Child Currently Receiving WIC Benefits Rhode Island, 2005-2006 Percent Source: 2005-2006 National Immunization Survey
4:3:1:3:3:1 Series Coverage Rate by Mother’s Education Rhode Island, 2005-2006 Percent Source: 2005-2006 National Immunization Survey
4:3:1:3:3:1 Series Coverage Rate by Birth Order Rhode Island, 2005-2006 Percent Source: 2005-2006 National Immunization Survey
4:3:1:3:3:1 Series Coverage Rate by Poverty Status Rhode Island, 2005-2006 Percent Source: 2005-2006 National Immunization Survey
4:3:1:3:3:1 Series Coverage Rate by Hispanic Origin of Child Rhode Island, 2005-2006 Percent Source: 2005-2006 National Immunization Survey
4:3:1:3:3:1 Series Coverage Rate by Race/Ethnicity Rhode Island, 2005-2006 Percent Source: 2005-2006 National Immunization Survey
4:3:1:3:3:1 Series Coverage Rate by Mother’s Marital Status Rhode Island, 2005-2006 Percent Source: 2005-2006 National Immunization Survey
4:3:1:3:3:1 Series Coverage Rate by Interview Language Rhode Island, 2005-2006 Percent Source: 2005-2006 National Immunization Survey
4:3:1:3:3:1 Series Coverage Rate by Mobility Status Rhode Island, 2005-2006 Percent Source: 2005-2006 National Immunization Survey
4:3:1:3:3:1 Series Coverage Rate by Mother’s Age Rhode Island, 2005-2006 Percent Source: 2005-2006 National Immunization Survey
4:3:1:3:3:1 Series Coverage Rate by Facility Type Rhode Island, 2005-2006 Percent * Other Facilities include Public Facilities, Hospitals, Military Facilities, and Mixed Source: 2005-2006 National Immunization Survey
4:3:1:3:3:1 Series Coverage Rate by Provider Status on Reporting to Registry, Rhode Island, 2005-2006 Percent Source: 2005-2006 National Immunization Survey