Download

1 / 25
250 likes | 402 Vues
UWHC Scholarly Forum April 17, 2013 Ismor Fischer, Ph.D. UW Dept of Statistics, UW Dept of Biostatistics and Medical Informatics ifischer@wisc.edu. STATISTICS IN A NUTSHELL. UWHC Scholarly Forum April 17, 2013 Ismor Fischer, Ph.D. UW Dept of Statistics,

E N D
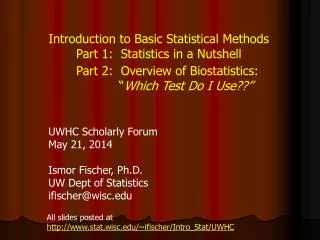
UWHC Scholarly Forum April 17, 2013 IsmorFischer, Ph.D. UW Dept of Statistics, UW Dept of Biostatistics and Medical Informatics ifischer@wisc.edu
STATISTICS IN A NUTSHELL UWHC Scholarly Forum April 17, 2013 IsmorFischer, Ph.D. UW Dept of Statistics, UW Dept of Biostatistics and Medical Informatics ifischer@wisc.edu All slides posted at http://www.stat.wisc.edu/~ifischer/UWHC
Click on image for full .pdf article • Links in article to access datasets
“Statistical Inference” POPULATION Study Question: Has “Mean (i.e., average) Age at First Birth” of women in the U.S. changed since 2010 (25.4yrs old)? Present Day: Assume “Mean Age at First Birth” follows a normal distribution (i.e., “bell curve”) in the population.
~ The Normal Distribution ~ “population standard deviation” “population mean” • symmetric about its mean Example: Body Temp (°F) low variability 98.6 • unimodal (i.e., one peak), • with left and right “tails” • models many (but not all) • naturally-occurring systems • useful mathematical • properties…
~ The Normal Distribution ~ “population standard deviation” “population mean” • symmetric about its mean Example: Body Temp (°F) low variability 98.6 Example: IQ score high variability 100 • unimodal (i.e., one peak), • with left and right “tails” • models many (but not all) • naturally-occurring systems • useful mathematical • properties…
~ The Normal Distribution ~ “population standard deviation” 95% 2.5% 2.5% ≈ 2 σ ≈ 2 σ “population mean” • symmetric about its mean Approximately 95% of the population values are contained between – 2σ and + 2σ. • unimodal (i.e., one peak), • with left and right “tails” • models many (but not all) • naturally-occurring systems 95% is called the confidence level. 5% is called the significance level. • useful mathematical • properties…
“Statistical Inference” POPULATION via… “Hypothesis Testing” Study Question: Has “Mean (i.e., average) Age at First Birth” of women in the U.S. changed since 2010 (25.4 yrs old)? Present Day: Assume “Mean Age at First Birth” follows a normal distribution (i.e., “bell curve”) in the population. cannot be found with 100% certainty, but can be estimated with high confidence (e.g., 95%). H0: pop mean age = 25.4 (i.e., no change since 2010) “Null Hypothesis”
“Statistical Inference” POPULATION via… “Hypothesis Testing” Study Question: Has “Mean (i.e., average) Age at First Birth” of women in the U.S. changed since 2010 (25.4 yrs old)? Present Day: Assume “Mean Age at First Birth” follows a normal distribution (i.e., “bell curve”) in the population. T-test H0: pop mean age = 25.4 (i.e., no change since 2010) Random Sample size n = 400 ages “Null Hypothesis” x4 x1 x3 FORMULA x2 x5 sample mean age … etc… ? x400 Do the data tend to support or refute the null hypothesis? Is the difference STATISTICALLY SIGNIFICANT, at the 5% level?
~ The Normal Distribution ~ CENTRAL LIMIT THEOREM ? Samples, size n … etc…
~ The Normal Distribution ~ 95% 2.5% 2.5% ≈ 2 σ ≈ 2 σ Approximately 95% of the population values are contained between – 2σ and + 2σ. Approximately 95% of the intervals from to contain , and approx 5% do not. Approximately 95% of the sample mean values are contained between and
Approximately 95% of the intervals from to contain , and approx 5% do not. 95% margin of error
“Statistical Inference” POPULATION via… “Hypothesis Testing” Study Question: Has “Mean (i.e., average) Age at First Birth” of women in the U.S. changed since 2010 (25.4 yrs old)? Present Day: Assume “Mean Age at First Birth” follows a normal distribution (i.e., “bell curve”) in the population. “Null Hypothesis” H0: pop mean age = 25.4 (i.e., no change since 2010) FORMULA SAMPLE n = 400 ages Approximately 95% of the intervals from to contain , and approx 5% do not. x4 x1 x3 x2 x5 sample mean … etc… = 25.6 x400 PROBLEM! σis unknown the vast majority of the time! 95% margin of error
“Statistical Inference” POPULATION via… “Hypothesis Testing” Study Question: Has “Mean (i.e., average) Age at First Birth” of women in the U.S. changed since 2010 (25.4 yrs old)? Present Day: Assume “Mean Age at First Birth” follows a normal distribution (i.e., “bell curve”) in the population. “Null Hypothesis” H0: pop mean age = 25.4 (i.e., no change since 2010) FORMULA SAMPLE n = 400 ages x4 x1 sample variance x3 = modified average of the squared deviations from the mean x2 x5 sample mean … etc… = 25.6 x400 sample standard deviation 95% margin of error
“Statistical Inference” POPULATION via… “Hypothesis Testing” Study Question: Has “Mean (i.e., average) Age at First Birth” of women in the U.S. changed since 2010 (25.4 yrs old)? Present Day: Assume “Mean Age at First Birth” follows a normal distribution (i.e., “bell curve”) in the population. “Null Hypothesis” H0: pop mean age = 25.4 (i.e., no change since 2010) FORMULA SAMPLE n = 400 ages x4 x1 sample variance x3 x2 x5 sample mean … etc… = 25.6 x400 sample standard deviation 95% margin of error = 1.6 = 0.16
Approximately 95% of the intervals from to contain , and approx 5% do not.
95% margin of error = 0.16 = 0.16 25.44 25.76 BASED ON OUR SAMPLE DATA, the true value of μ today is between 25.44 and 25.76 years, with 95% “confidence” (…akin to “probability”).
Two main ways to conduct a formal hypothesis test: 95% CONFIDENCE INTERVAL FOR µ 25.44 25.76 BASED ON OUR SAMPLE DATA, the true value of μ today is between 25.44 and 25.76 years, with 95% “confidence” (…akin to “probability”). IF H0 is true, then we would expect a random sample mean that is at least 0.2 years away from = 25.4 (as ours was), to occur with probability 1.24%. “P-VALUE” of our sample Very informally, the p-value of a sample is the probability (hence a number between 0 and 1) that it “agrees” with the null hypothesis. Hence a very small p-value indicates strong evidence against the null hypothesis. The smaller the p-value, the stronger the evidence, and the more “statistically significant” the finding.
Two main ways to conduct a formal hypothesis test: • FORMAL CONCLUSIONS: • The 95% confidence interval corresponding to our sample mean does not contain the “null value” of the population mean, μ = 25.4 years. • The p-value of our sample, .0124, is less than the predetermined α = .05 significance level. • Based on our sample data, we may (moderately) reject the null hypothesis H0: μ = 25.4 in favor of the two-sided alternative hypothesis HA: μ ≠ 25.4, at the α = .05 significance level. • INTERPRETATION: According to the results of this study, there exists a statistically significantdifference between the mean ages at first birth in 2010 (25.4 years old) and today, at the 5% significance level. Moreover, the evidence from the sample data would suggest that the population mean age today is significantly older than in 2010, rather than significantly younger. 95% CONFIDENCE INTERVAL FOR µ 25.44 25.76 BASED ON OUR SAMPLE DATA, the true value of μ today is between 25.44 and 25.76 years, with 95% “confidence” (…akin to “probability”). IF H0 is true, then we would expect a random sample mean that is at least 0.2 years away from = 25.4 (as ours was), to occur with probability 1.24%. “P-VALUE” of our sample Very informally, the p-value of a sample is the probability (hence a number between 0 and 1) that it “agrees” with the null hypothesis. Hence a very small p-value indicates strong evidence against the null hypothesis. The smaller the p-value, the stronger the evidence, and the more “statistically significant” the finding.
“Statistical Inference” POPULATION via… “Hypothesis Testing” Study Question: Has “Mean (i.e., average) Age at First Birth” of women in the U.S. changed since 2010 (25.4 yrs old)? Present Day: Assume “Mean Age at First Birth” follows a normal distribution (i.e., “bell curve”) in the population. T-test Two loose ends H0: pop mean age = 25.4 (i.e., no change since 2010) Random Sample size n = 400 ages “Null Hypothesis” x4 x1 x3 FORMULA x2 x5 sample mean age … etc… x400 Do the data tend to support or refute the null hypothesis? Is the difference STATISTICALLY SIGNIFICANT, at the 5% level?
“Statistical Inference” POPULATION via… “Hypothesis Testing” Study Question: Has “Mean (i.e., average) Age at First Birth” of women in the U.S. changed since 2010 (25.4 yrs old)? Present Day: Assume “Mean Age at First Birth” follows a normal distribution (i.e., “bell curve”) in the population. T-test Two loose ends H0: pop mean age = 25.4 (i.e., no change since 2010) “Null Hypothesis” Check? The reasonableness of the normality assumption is empirically verifiable, and in fact formally testable from the sample data. If violated (e.g., skewed) or inconclusive (e.g., small sample size), then “distribution-free” nonparametric tests can be used instead of the T-test. Examples: Sign Test, Wilcoxon Signed Rank Test (= Mann-Whitney Test)
“Statistical Inference” POPULATION via… “Hypothesis Testing” Study Question: Has “Mean (i.e., average) Age at First Birth” of women in the U.S. changed since 2010 (25.4 yrs old)? Present Day: Assume “Mean Age at First Birth” follows a normal distribution (i.e., “bell curve”) in the population. T-test Two loose ends H0: pop mean age = 25.4 (i.e., no change since 2010) Random Sample size n = 400 ages “Null Hypothesis” x4 x1 x3 x2 Sample size npartially depends on the power of the test, i.e., the desired probability of correctly rejecting a false null hypothesis.HOWEVER…… x5 … etc… x400
~ The Normal Distribution ~ Approximately 95% of the population values are contained between – 2σ and + 2σ. “population standard deviation” 95% 2.5% 2.5% ≈ 2 σ ≈ 2 σ “population mean” Samples, size n Approximately 95% of the intervals from to contain , and approx 5% do not. Approximately 95% of the sample mean values are contained between and … etc…
~ The Normal Distribution ~ Approximately 95% of the population values are contained between – 2sand + 2s. “population standard deviation” 95% 2.5% 2.5% ≈ 2 σ ≈ 2 σ “population mean” Samples, size n Approximately 95% of the intervals from to contain , and approx 5% do not. Approximately 95% of the sample mean values are contained between and …IFn is large, 30 traditionally. But if n is small… … this “T-score" increases (from ≈ 2 to a max of 12.706 for a 95% confidence level) as n decreases larger margin of error less power to reject. … etc…
If n is small, T-score > 2. If n is large, T-score ≈ 2.