Download
1 / 82
830 likes | 1.12k Vues
November 18, 2013 Ch. 9 Key Issue 1. BW- What is Development?????? Upon answering question, students will review and watch- “The Science of Overpopulation” -How does this affect development????. VACATION. Where would we like to go on vacation?

E N D
November 18, 2013 Ch. 9 Key Issue 1 • BW- What is Development?????? • Upon answering question, students will review and watch- “The Science of Overpopulation” -How does this affect development????
VACATION • Where would we like to go on vacation? • Preferably a popular, yet less-developed destination • What makes this an attractive destination? • Amenities, climate, scenery, food/lodging $ • Are the people who live in this place year-round fortunate to live at such a desirable location? • What do the local people depend on for income? • What do the people in this country who do not live in a tourist area do for work? • Can any of these people who want to vacation in the US come? Why/why not?
A world divided • The world is divided by relatively rich and relatively poor countries • We will try to understand the reasons for this division and learn what can be done about it • Caribbean island vacation • Who works at the resorts? • What is life like surrounding the resort? • How would you feel?
What is Development?November 18, 2013 The process of improving the material conditions of people through the diffusion of knowledge and technology More developed countries (MDCs) AKA developed countries Lesser developed countries (LDCs) AKA emerging or developing countries
Course Outline • VI.Industrialization and Economic Development 13–17% • A.Growth and diffusion of industrialization • 1.The changing roles of energy and technology • 2.Industrial Revolution • 3.Evolution of economic cores and peripheries • 4.Geographic critiques of models of economic localization • (i.e., bid rent, comparative costs of transportation), industrial • location, economic development, and world systems
Content Area section) • B.Contemporary patterns and impacts of industrialization and • development • 1.Spatial organization of the world economy • 2.Variations in levels of development • 3.Deindustrialization and economic restructuring • 4.Globalization and international division of labor • 5.Natural resources and environmental concerns • 6.Sustainable development • 7.Local development initiatives: government policies • 8.Women in development
ECONOMIC INDICATORS OF DEVELOPMENT • 5 factors: Most important GDP • Economic structure, worker productivity, access to raw materials, and availability of consumer goods GDP PER CAPITA • MDC: $15 per hour • LDC: $2 per hour • GDP: value of the total output of goods & services produced in a country • Divide GDP by population = contribution made by the ave individual toward generating a countries wealth in a year
Types of jobs • Jobs fall into 3 categories: • Primary, Secondary, Tertiary • Comparing types of economic activities in MDC/LDC • Look at the % of people working in each category • Primary sector: directly extract materials from E • Via farming, mining, fishing, foresting • Secondary: process, transform, and assemble raw materials into useful products • Tertiary: provision of goods in exchange of $ • Retail, banking, law, education, & gov’t
Economic indicators of development Economic activities: • Primary sector • Secondary sector • Tertiary sector: Quaternary, Quinary
Productivity • Productivity: value of a product compared to amount of labor needed to make it • Value added: gross value of the product – the cost of raw materials and energy • ~$80k US, $70k Japan, $1k China, $500 India • Workers in MDCs produce more w/ less effort • More machines, tools, equipment, etc. • MDC workers are more productive
Raw materials • Development requires raw materials & energy sources • Iron Ore and Coal help transform UK in late 18th C • Resources depleted, est. colonies to import more • Specific raw materials become important bring dvlpmt • If an LDC has oil, they may develop to an MDC • A country’s abundance of resources=chance of dvlpmt • Exceptions to that rule • Japan, Singapore, S.Korea, and Switzerland • Success through world trade
Consumer goods • MDC: goods & services devoted to transp & comm. • Vehicles, phones, computers • Helps provide access to jobs & spreads info • More leisure activities available • LDC: Not as concerned with tech. advances • “Haves” and “Have nots” • Spread from urban to rural • Connecting MDCs and LDCs through technology
How is development measured? • Social indicators of development • Education and literacy • The literacy rate • Health and welfare • Diet (adequate calories) • Access to health care
How is development measured? • Demographic indicators of development • Life expectancy • Babies born today in MDCs have a life expectancy in the 70s; babies born in LDCs, in the 60s • Other demographic indicators: • Infant mortality • Natural increase • Crude birth rate
Education & Literacy • More developed=^quantity and quality the edu. • Quantity=ave # of school years attended • Quality=student/teacher ratio and literacy rate • Literacy rate: % of people who can read/write • MDCs=98% LDC=60% • MDC=10 years in school • LDC=a few • MDC: student/teacher ratio is 2x higher than LDC
Student-Teacher Ratios Students per teacher, primary school level. Primary school teachers have much larger class sizes in LDCs than in MDCs, partly because of the large numbers of young people in the population (Also, refer to Fig. 2-15).
Persons per Physician There is a physician for every 500 or fewer people in most MDCs, while thousands of people share a doctor on average in LDCs. Especially in rural areas. Urban areas tend to be much better served.
Calories per Capita Daily available calories per capita as percent of requirements. In MDCs, the average person consumes one-third or more over the required average minimum, which accounts for the obesity found in North America and some affluent countries. In LDCs, the average person gets only the minimum requirement or less.
US RANKINGS • 1st economically • 17th in education • 28th math • 18th reading • 22nd science • 1st in crime • 1st incarceration • 24th homicide • 1st obesity • 19th democratic freedoms
November 19, 2013MDC v. LDC- Activity • Students will be placed in areas of the room labeled MDC and LDC based on accurate world population percentages. • As a class determine the percentage of the world’s population that lives in each section. Students will be based on an individual country. For example, 2 of the 5 students in MDC might be labeled U.S.A. • Discuss results. Was the outcome what you expected? Any surprises? What does it mean to be developed as a country?
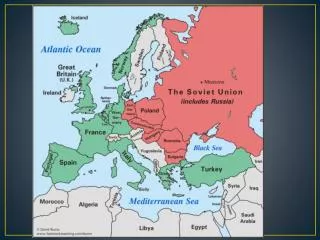
Where are MDCs and LDCs Distributed? • More developed regions • North America and Europe • Other MDCs with high HDI = Russia, Japan, Australia, and New Zealand • Less developed regions • Latin America = highest HDI among LDCs • Southwest Asia, Southeast Asia, Central Asia = similar HDI • South Asia and sub-Saharan Africa = low levels of development
Location of more/less developed countries • Countries are categorized into 9 regions • Based on their development • Japan and South Pacific aren’t part of the 9 • North-south Split • Circle the earth at 30º • Above 30º=MDC (for the most part) South=LDC
More and Less Developed Regions Figure 9-10
Today in Class: Students will color and label on maps, where the MDCs and LDCs are located. Students will work on worksheet, comparing LDCs and MDCs.
More Developed regions ANGLO-AMERICA (HDI .94) • USA/CANADA • English 1st lang. & most adhere to Christianity • Some cultural tension (race and religion) • Abundance of natural resources (decline of manu) • Leader in financial, mgmt, & high tech services • Big promoter and supplier of entertainment/leisure • World’s most important food exporter
More developed regions WESTERN EUROPE (HDI .93) • Indo-European languages & Christianity • Conflict arise over cultural identities • Competition among nationalities causes WWI & WWII • Influx of Muslims and Hindus spark pop growth • Highest level of development (exclude S Italy, Portugal, Spain and Greece) • Importers of food, energy minerals • Worlds largest and richest economic market
More developed regions EASTERN EUROPE (HDI .80) • Only region to decline since UN created the index in ’90 • Declining to Latin American level (LDC) due to communism • “Iron Curtain” 15º E longitude • Initially mass increase in per capita GDP ($100s1000s) • Communism didn’t cater to poor/agricultural societies • Gosplan: 5 year, 3 step economic plan • 1st: heavy industry-iron, steel, machine tools, weapons • 2nd: disperse production to the east (= development) • 3rd: Locate manu facilities near resources, not markets
More developed regions EASTERN EUROPE (HDI .80) • Abandon communist economic structure • Outdated equip, import food, impossible targets, • Lacked basic industry needs: clothes, cars, housing • Eastern Countries bordering W Europe • Easier transition to the market economy
More developed regions JAPAN (HDI .94) • Remarkable development despite natural resources • A world leader in steel prod. yet imports all coal and iron • 1 asset: abundance of ppl willing to work for low wages • Sell product overseas for cheaper than domestic co. • THEN specialize in high-valued products: electronics • Spend 2x more on R&D than the U.S. • Rigorous edu & training programs for skilled labor
More developed regions SOUTH PACIFIC (HDI .87) • High HDI but not as relative in global econ. • Smaller pop • Comparable to most other MDC HDIs
Bellwork: 11/21 • What does Gender Inequality mean?
Today in Class: • There will be a physical features map quiz of Africa. • Next, we will head to the computer lab to look at HDI information.
11/22- Today in class Students will work on HDI assignment- referencing cia.gov.
Human Development Index: HDIhttp://hdr.undp.org/en/statistics/hdi/
HDI only includes income from the formal market. Reported to the government, pay taxes. Formal Market: Ecuador Informal Market: Ecuador
HDI does not include income from the informal market. Not reported to the government, no taxes paid. Formal Market: Brazil Informal Market: Brazil
BELLWORK: 12/2 Students will watch TED TALK, what does the Washing Machine symbolize?
http://www.gapminder.org/videos/hans-rosling-and-the-magic-washing-machine/http://www.gapminder.org/videos/hans-rosling-and-the-magic-washing-machine/
ROSTOW and His Model • The work of American Walt W. Rostow • Rostow is an economic historian • Countries can be placed in one of five categories in terms of its stage of growth
How do countries develop? • If we can understand how development occurs, strategies can be adopted to help countries to develop
STUDENTS Will Create a Matrix of Rostow’s Stages of Development • Traditional Society • Characterised by • subsistence economy – output not traded or recorded • existence of barter • high levels of agriculture and labour intensive agriculture
2. Pre-conditions: • Development of mining industries • Increase in capital use in agriculture • Necessity of external funding • Some growth in savings and investment
3. Take off: • Increasing industrialisation • Further growth in savings and investment • Some regional growth • Number employed in agriculture declines
4. Drive to Maturity: • Growth becomes self-sustaining – wealth generation enables further investment in value adding industry and development • Industry more diversified • Increase in levels of technology utilised
5. High mass consumption • High output levels • Mass consumption of consumer durables • High proportion of employment in service sector
Country Analysis and Comparisson • http://www.bized.co.uk/educators/16-19/economics/development/activity/models.htm