Download
1 / 1
10 likes | 14 Vues
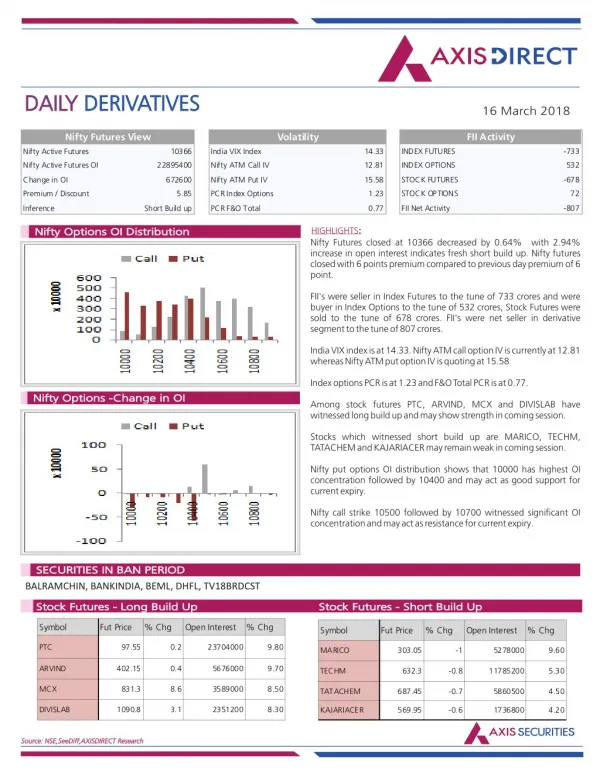
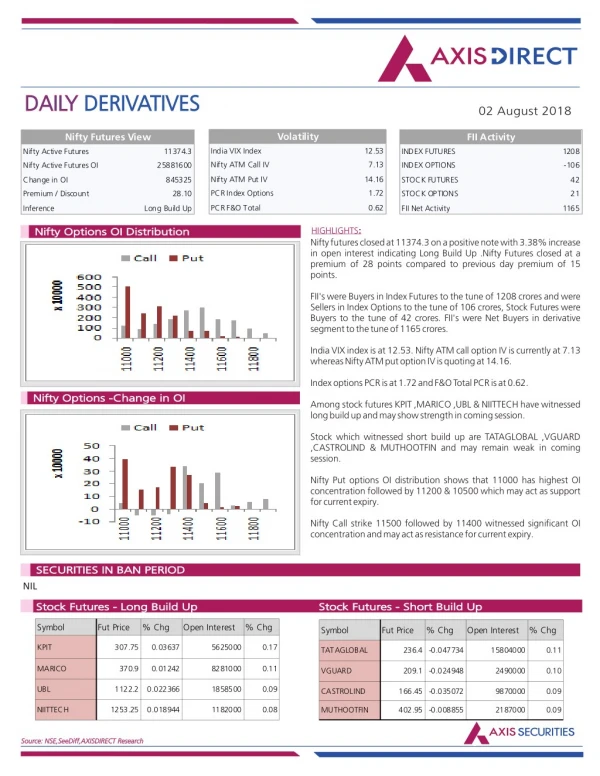
Axis Direct presents daily derivatives report presenting recommendations based on technical analysis. For trading in derivatives visit https://simplehai.axisdirect.in/offerings/products/derivatives<br>https://simplehai.axisdirect.in/share-stock-prices/nse/Cipla-Ltd-114<br>https://simplehai.axisdirect.in/share-stock-prices/nse/ICICI-Bank-Ltd-5418<br>https://simplehai.axisdirect.in/share-stock-prices/nse/ITC-Ltd-301<br>

E N D
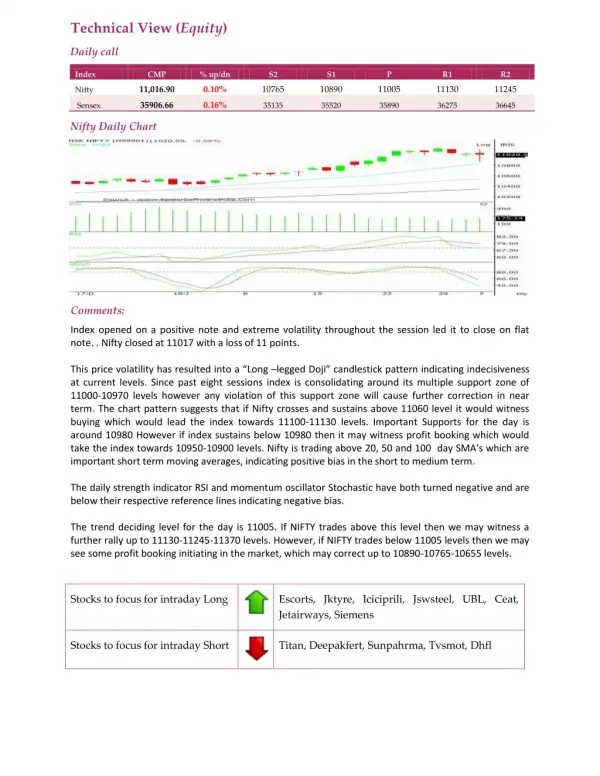
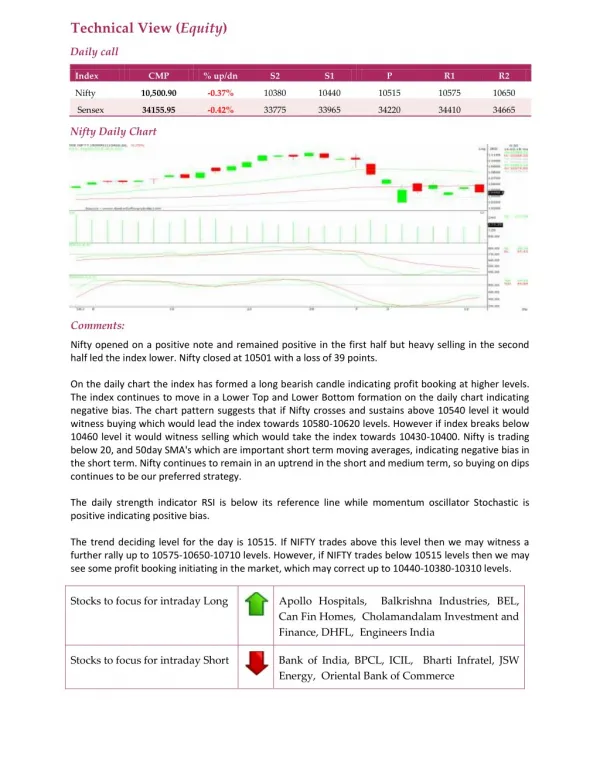
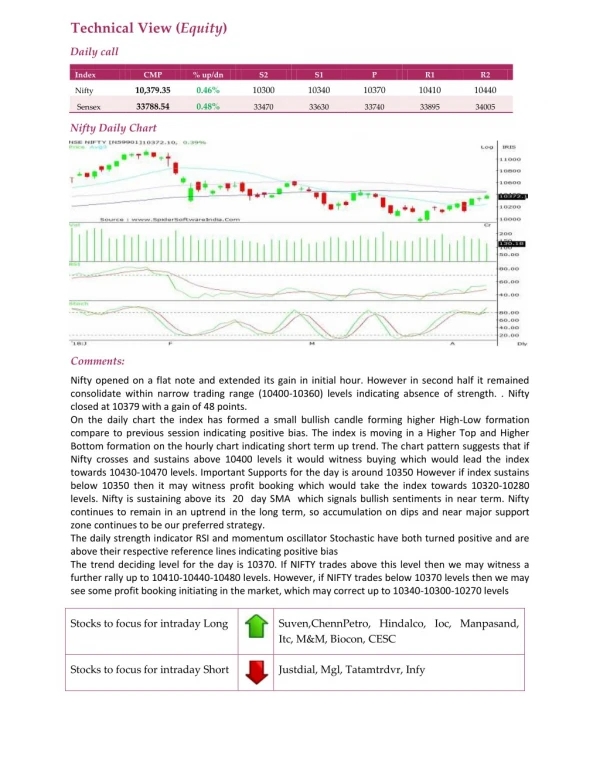
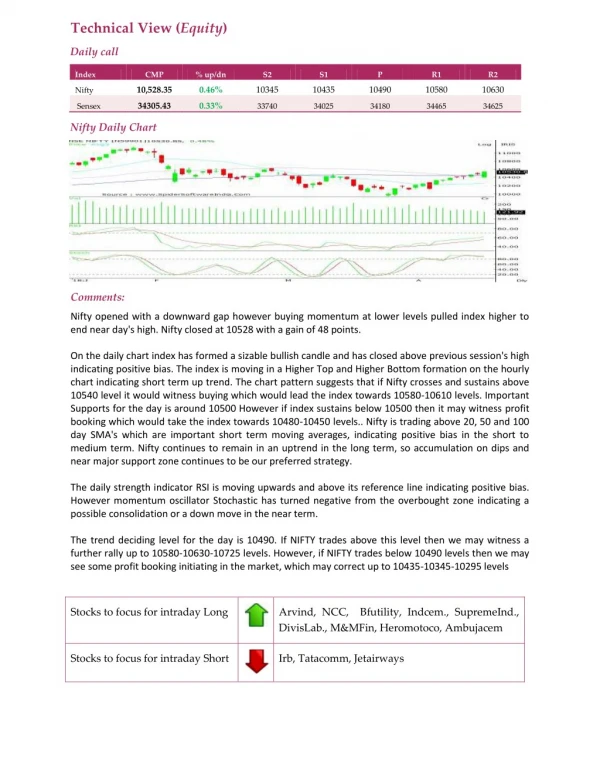
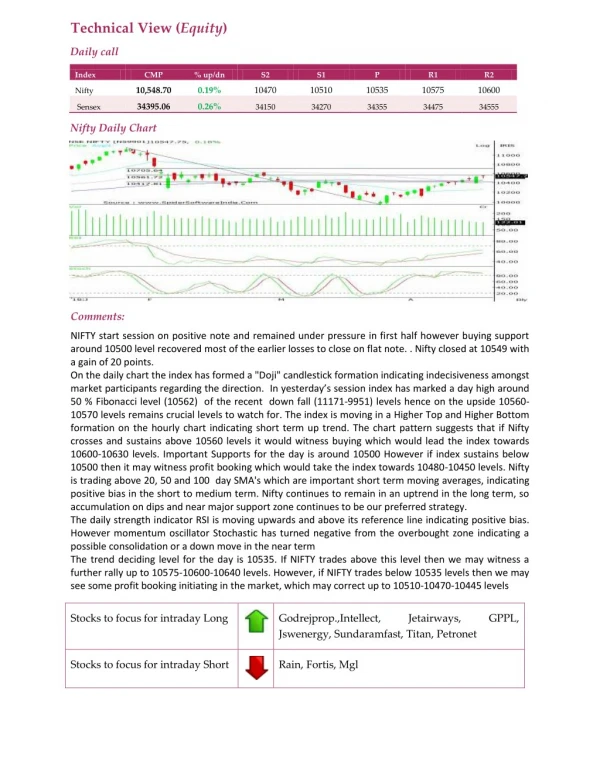
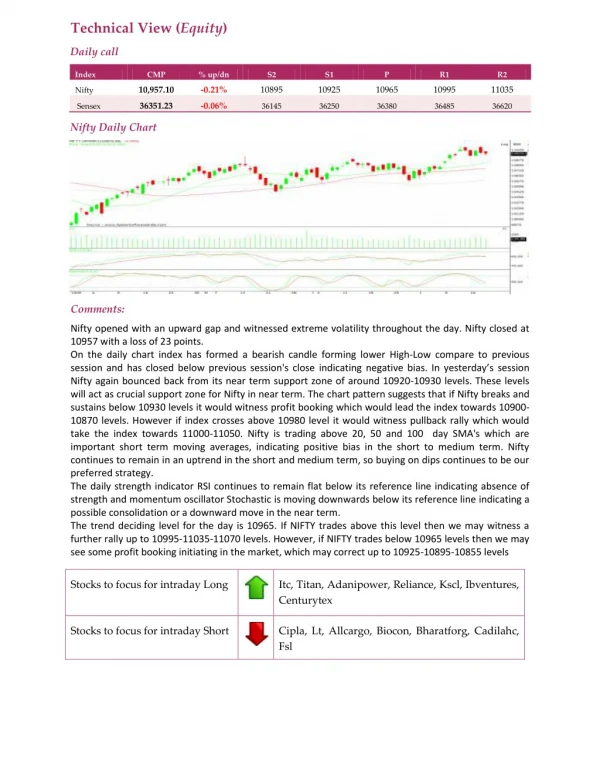
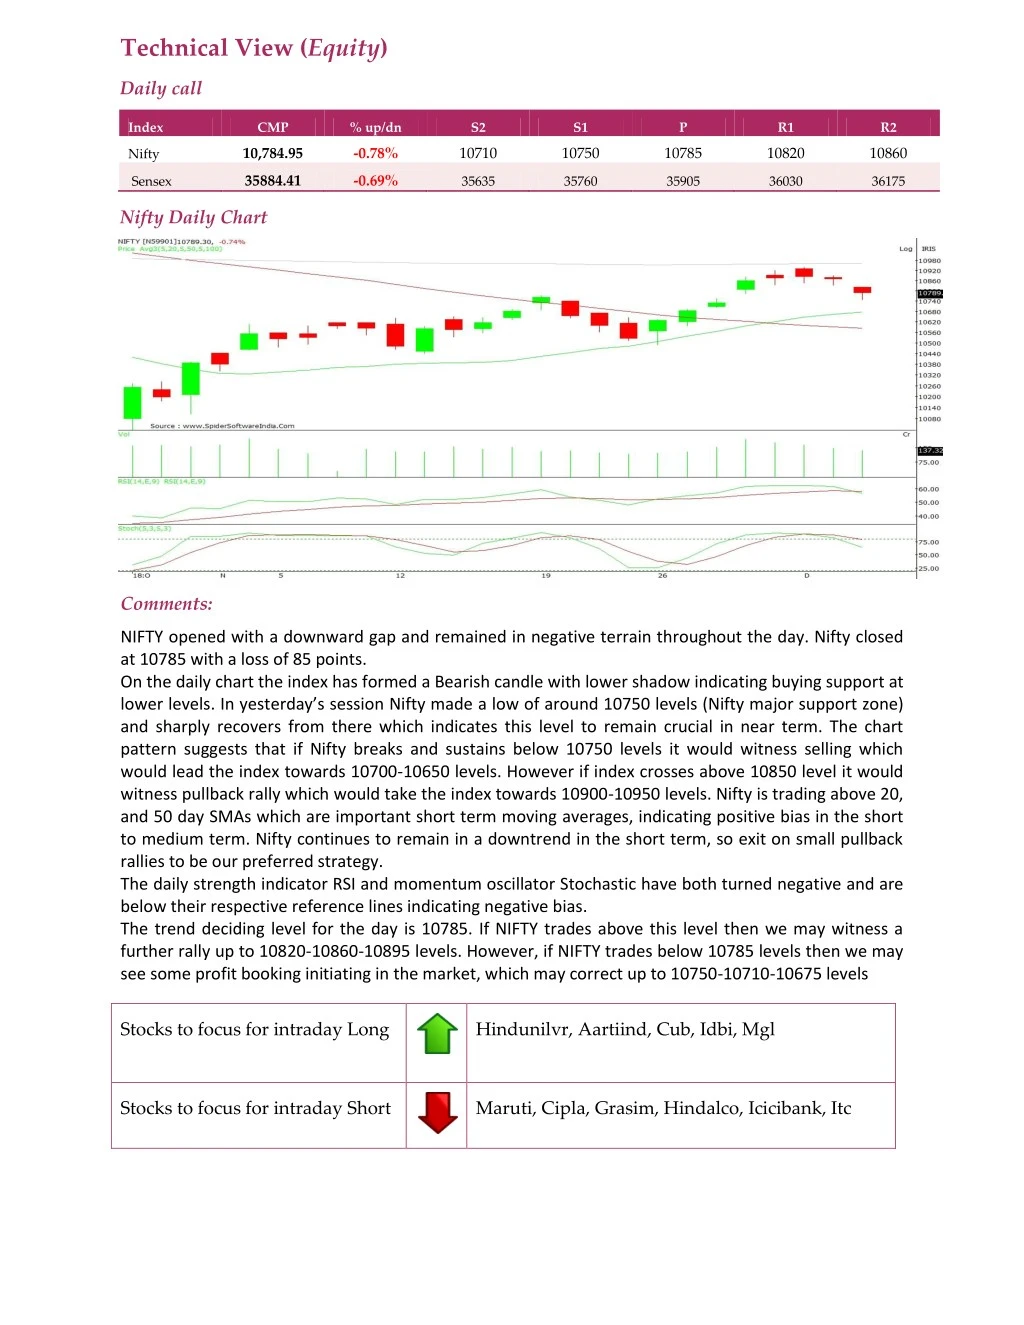
Technical View (Equity) Daily call Index CMP % up/dn S2 S1 P R1 R2 10,784.95 -0.78% 10710 10750 10785 10820 10860 Nifty 35884.41 -0.69% Sensex 35635 35760 35905 36030 36175 Nifty Daily Chart Comments: NIFTY opened with a downward gap and remained in negative terrain throughout the day. Nifty closed at 10785 with a loss of 85 points. On the daily chart the index has formed a Bearish candle with lower shadow indicating buying support at lower levels. In yesterday’s session Nifty made a low of around 10750 levels (Nifty major support zone) and sharply recovers from there which indicates this level to remain crucial in near term. The chart pattern suggests that if Nifty breaks and sustains below 10750 levels it would witness selling which would lead the index towards 10700-10650 levels. However if index crosses above 10850 level it would witness pullback rally which would take the index towards 10900-10950 levels. Nifty is trading above 20, and 50 day SMAs which are important short term moving averages, indicating positive bias in the short to medium term. Nifty continues to remain in a downtrend in the short term, so exit on small pullback rallies to be our preferred strategy. The daily strength indicator RSI and momentum oscillator Stochastic have both turned negative and are below their respective reference lines indicating negative bias. The trend deciding level for the day is 10785. If NIFTY trades above this level then we may witness a further rally up to 10820-10860-10895 levels. However, if NIFTY trades below 10785 levels then we may see some profit booking initiating in the market, which may correct up to 10750-10710-10675 levels Stocks to focus for intraday Long Hindunilvr, Aartiind, Cub, Idbi, Mgl Stocks to focus for intraday Short Maruti, Cipla, Grasim, Hindalco, Icicibank, Itc