Download
1 / 1
10 likes | 23 Vues
Axis Direct presents daily derivatives report presenting recommendations based on technical analysis. For trading in derivatives visit https://simplehai.axisdirect.in/offerings/products/derivatives<br>https://simplehai.axisdirect.in/share-stock-prices/nse/Just-Dial-Ltd-41369<br>https://simplehai.axisdirect.in/share-stock-prices/nse/Tata-Steel-Ltd-566<br>https://simplehai.axisdirect.in/share-stock-prices/nse/Tata-Consultancy-Services-Ltd-5400<br>https://simplehai.axisdirect.in/share-stock-prices/nse/Coal-India-Ltd-12019<br>

E N D
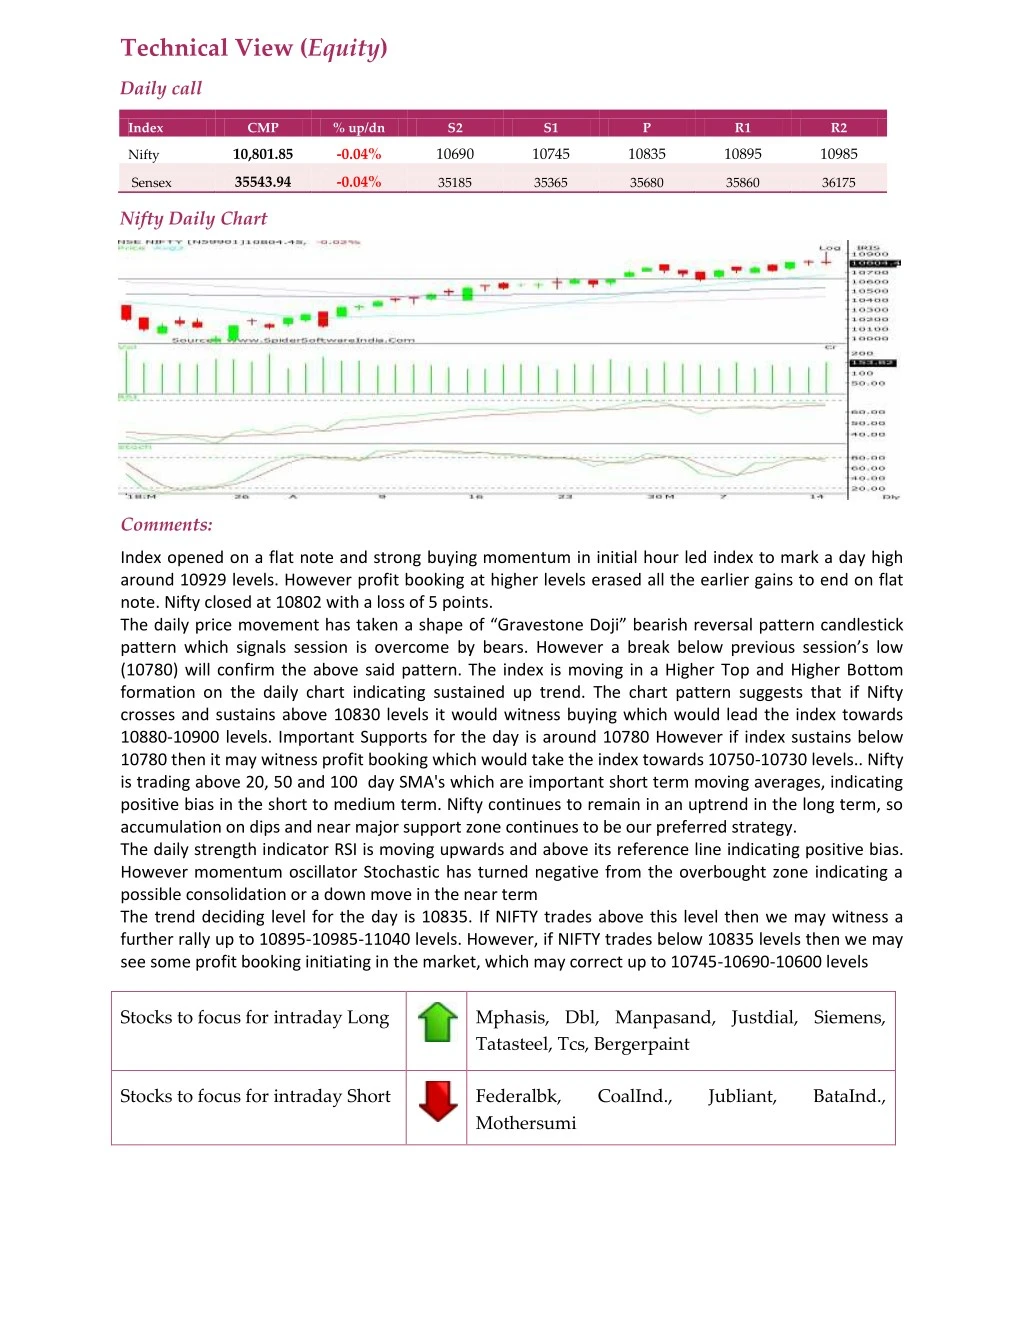
Technical View (Equity) Daily call Index CMP % up/dn S2 S1 P R1 R2 10,801.85 -0.04% 10690 10745 10835 10895 10985 Nifty 35543.94 -0.04% Sensex 35185 35365 35680 35860 36175 Nifty Daily Chart Comments: Index opened on a flat note and strong buying momentum in initial hour led index to mark a day high around 10929 levels. However profit booking at higher levels erased all the earlier gains to end on flat note. Nifty closed at 10802 with a loss of 5 points. The daily price movement has taken a shape of “Gravestone Doji” bearish reversal pattern candlestick pattern which signals session is overcome by bears. However a break below previous session’s low (10780) will confirm the above said pattern. The index is moving in a Higher Top and Higher Bottom formation on the daily chart indicating sustained up trend. The chart pattern suggests that if Nifty crosses and sustains above 10830 levels it would witness buying which would lead the index towards 10880-10900 levels. Important Supports for the day is around 10780 However if index sustains below 10780 then it may witness profit booking which would take the index towards 10750-10730 levels.. Nifty is trading above 20, 50 and 100 day SMA's which are important short term moving averages, indicating positive bias in the short to medium term. Nifty continues to remain in an uptrend in the long term, so accumulation on dips and near major support zone continues to be our preferred strategy. The daily strength indicator RSI is moving upwards and above its reference line indicating positive bias. However momentum oscillator Stochastic has turned negative from the overbought zone indicating a possible consolidation or a down move in the near term The trend deciding level for the day is 10835. If NIFTY trades above this level then we may witness a further rally up to 10895-10985-11040 levels. However, if NIFTY trades below 10835 levels then we may see some profit booking initiating in the market, which may correct up to 10745-10690-10600 levels Stocks to focus for intraday Long Mphasis, Dbl, Manpasand, Justdial, Siemens, Tatasteel, Tcs, Bergerpaint Stocks to focus for intraday Short Federalbk, Mothersumi CoalInd., Jubliant, BataInd.,


![Full{90k} W.a.t.c.h ("Samson") [2018] Movie {Online Free}"HD"](https://cdn4.slideserve.com/7787773/full-90k-w-a-t-c-h-samson-2018-movie-online-free-dt.jpg)