Download
1 / 1
10 likes | 19 Vues
Axis Direct presents daily derivatives report presenting recommendations based on technical analysis. For trading in derivatives visit https://simplehai.axisdirect.in/offerings/products/derivatives<br>https://simplehai.axisdirect.in/share-stock-prices/nse/Adani-Ports-&-Special-Economic-Zone-Ltd-21281<br>https://simplehai.axisdirect.in/share-stock-prices/nse/Coal-India-Ltd-12019

E N D
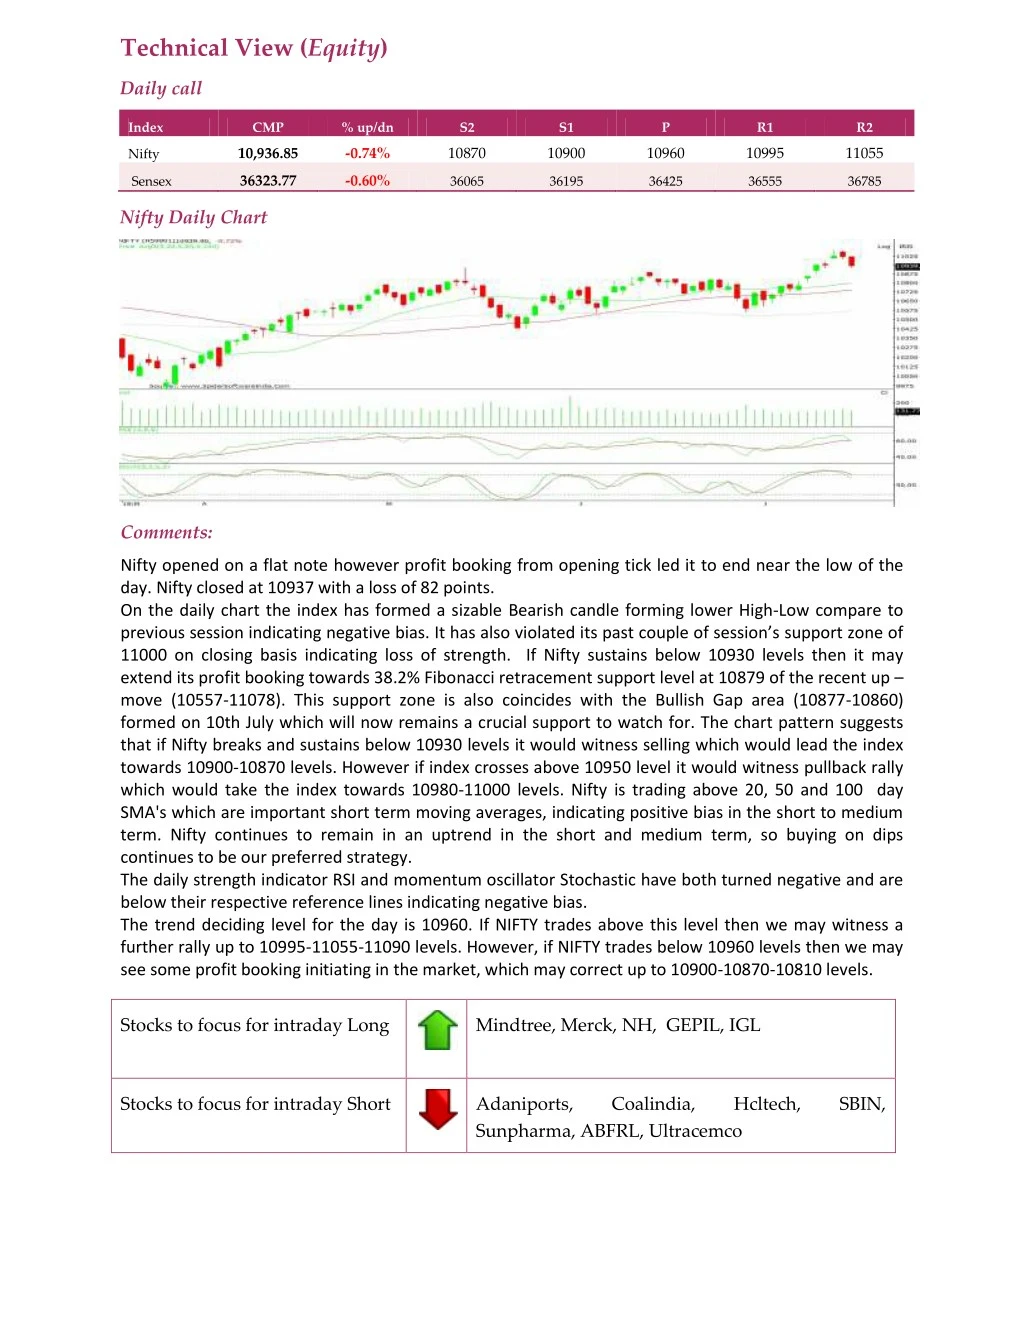
Technical View (Equity) Daily call Index CMP % up/dn S2 S1 P R1 R2 10,936.85 -0.74% 10870 10900 10960 10995 11055 Nifty 36323.77 -0.60% Sensex 36065 36195 36425 36555 36785 Nifty Daily Chart Comments: Nifty opened on a flat note however profit booking from opening tick led it to end near the low of the day. Nifty closed at 10937 with a loss of 82 points. On the daily chart the index has formed a sizable Bearish candle forming lower High-Low compare to previous session indicating negative bias. It has also violated its past couple of session’s support zone of 11000 on closing basis indicating loss of strength. If Nifty sustains below 10930 levels then it may extend its profit booking towards 38.2% Fibonacci retracement support level at 10879 of the recent up – move (10557-11078). This support zone is also coincides with the Bullish Gap area (10877-10860) formed on 10th July which will now remains a crucial support to watch for. The chart pattern suggests that if Nifty breaks and sustains below 10930 levels it would witness selling which would lead the index towards 10900-10870 levels. However if index crosses above 10950 level it would witness pullback rally which would take the index towards 10980-11000 levels. Nifty is trading above 20, 50 and 100 day SMA's which are important short term moving averages, indicating positive bias in the short to medium term. Nifty continues to remain in an uptrend in the short and medium term, so buying on dips continues to be our preferred strategy. The daily strength indicator RSI and momentum oscillator Stochastic have both turned negative and are below their respective reference lines indicating negative bias. The trend deciding level for the day is 10960. If NIFTY trades above this level then we may witness a further rally up to 10995-11055-11090 levels. However, if NIFTY trades below 10960 levels then we may see some profit booking initiating in the market, which may correct up to 10900-10870-10810 levels. Stocks to focus for intraday Long Mindtree, Merck, NH, GEPIL, IGL Stocks to focus for intraday Short Adaniports, Sunpharma, ABFRL, Ultracemco Coalindia, Hcltech, SBIN,


![Full{90k} W.a.t.c.h ("Samson") [2018] Movie {Online Free}"HD"](https://cdn4.slideserve.com/7787773/full-90k-w-a-t-c-h-samson-2018-movie-online-free-dt.jpg)