Download
1 / 1
10 likes | 11 Vues
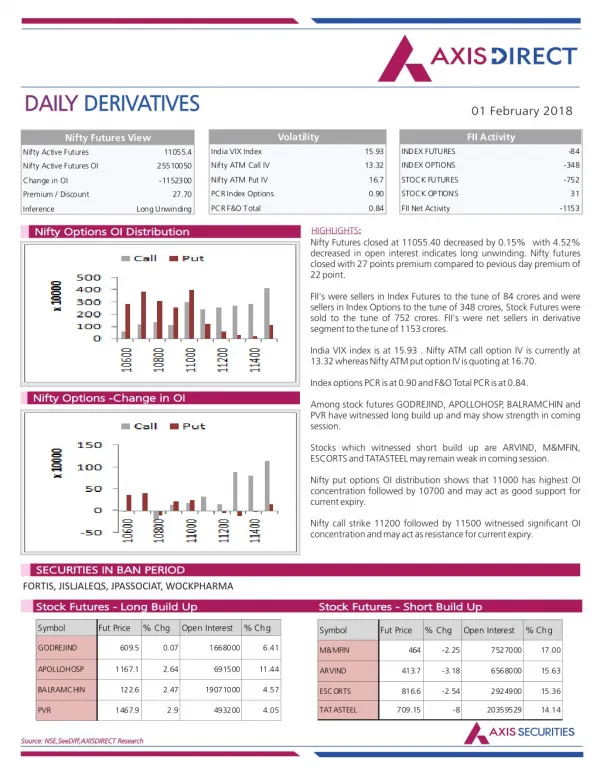
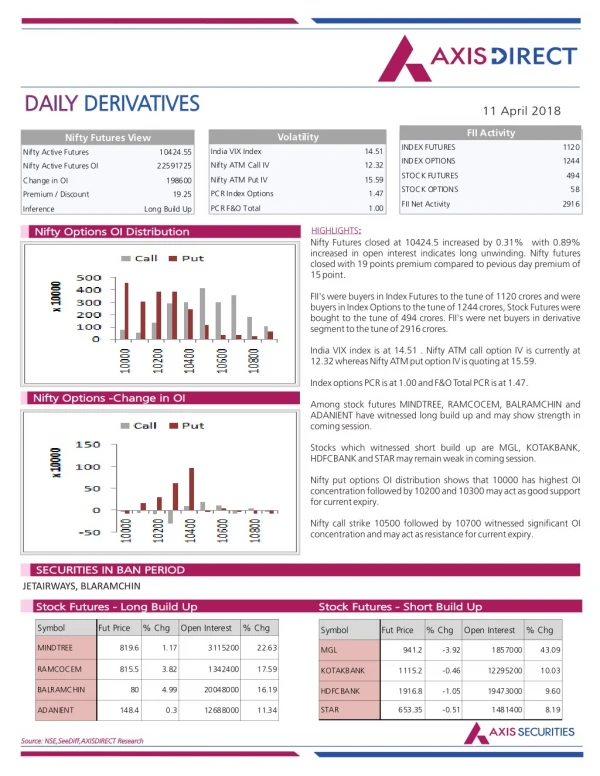
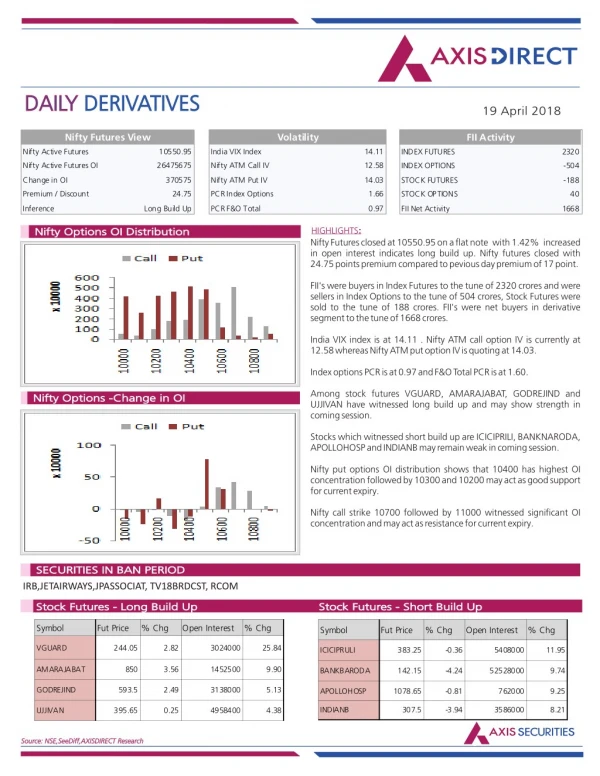
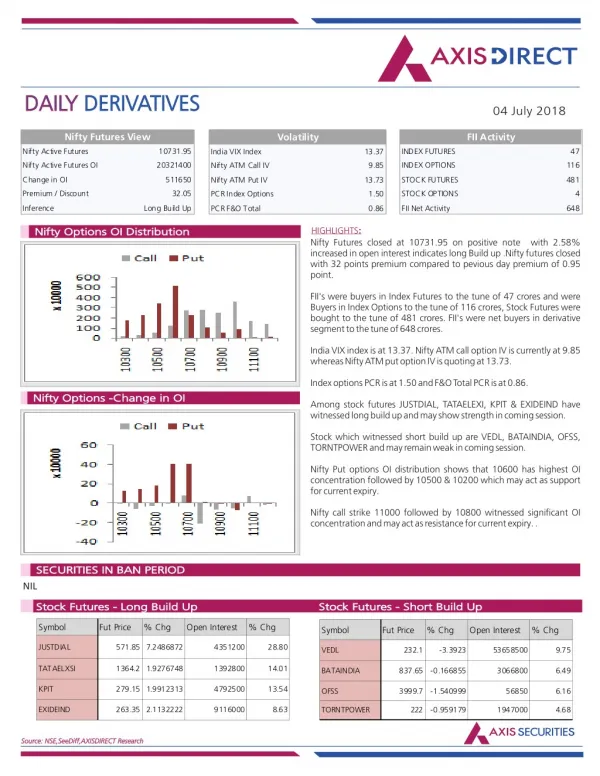
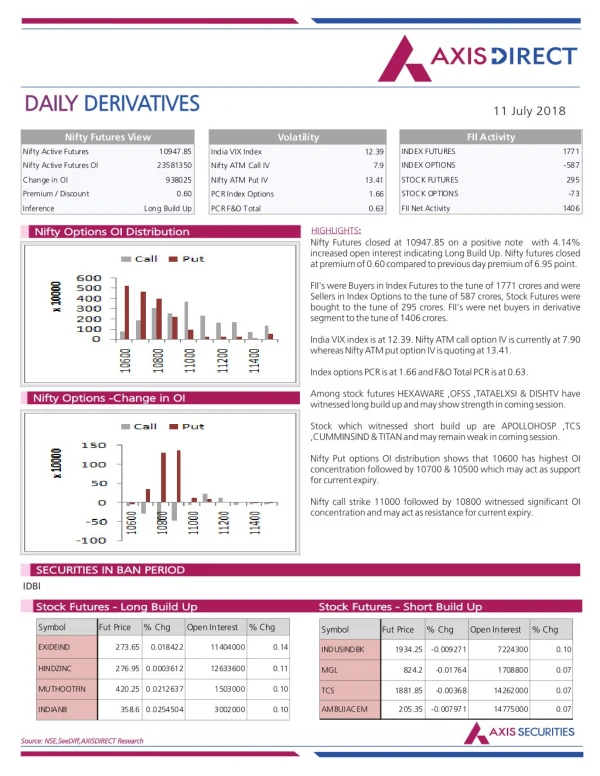
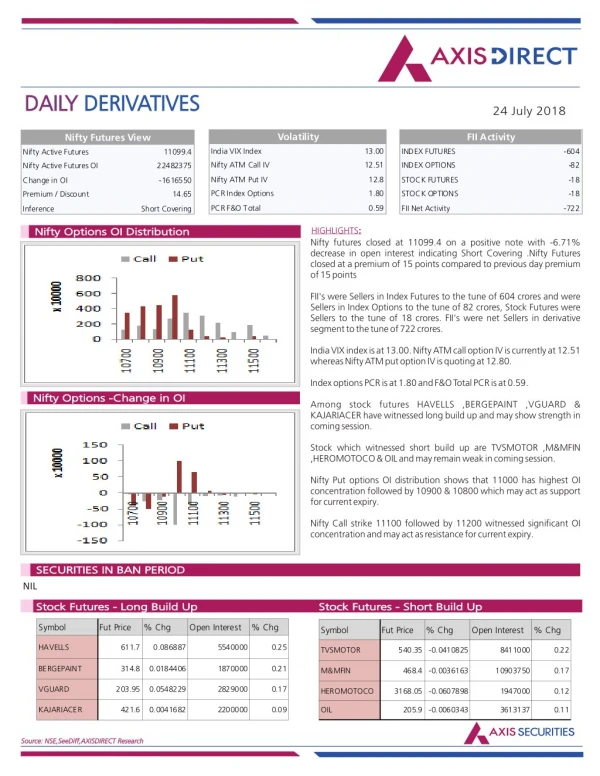
Axis Direct presents daily derivatives report presenting recommendations based on technical analysis. For trading in derivatives visit https://simplehai.axisdirect.in/offerings/products/derivatives<br>https://simplehai.axisdirect.in/share-stock-prices/nse/HDFC-Bank-Ltd-4987<br>https://simplehai.axisdirect.in/share-stock-prices/nse/Sun-Pharmaceuticals-Industries-Ltd-4325<br>https://simplehai.axisdirect.in/share-stock-prices/nse/Tata-Steel-Ltd-566<br>https://simplehai.axisdirect.in/share-stock-prices/nse/Yes-Bank-Ltd-25267

E N D
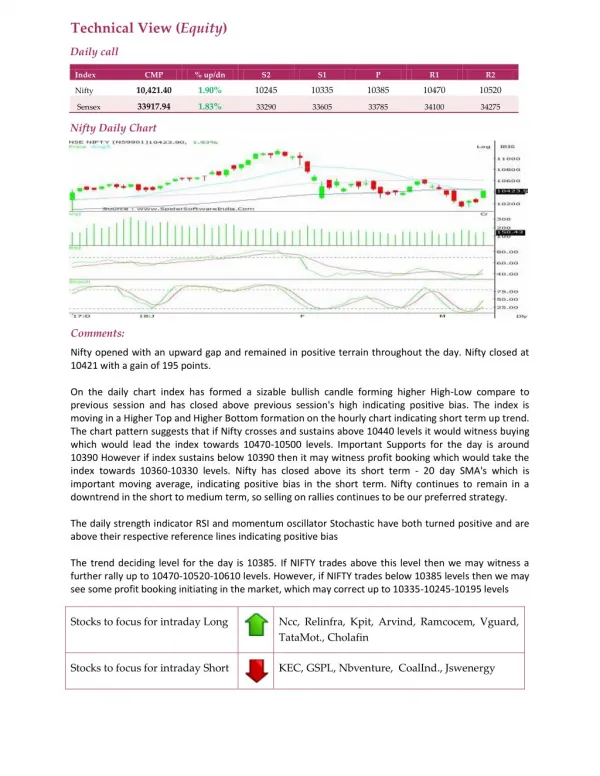
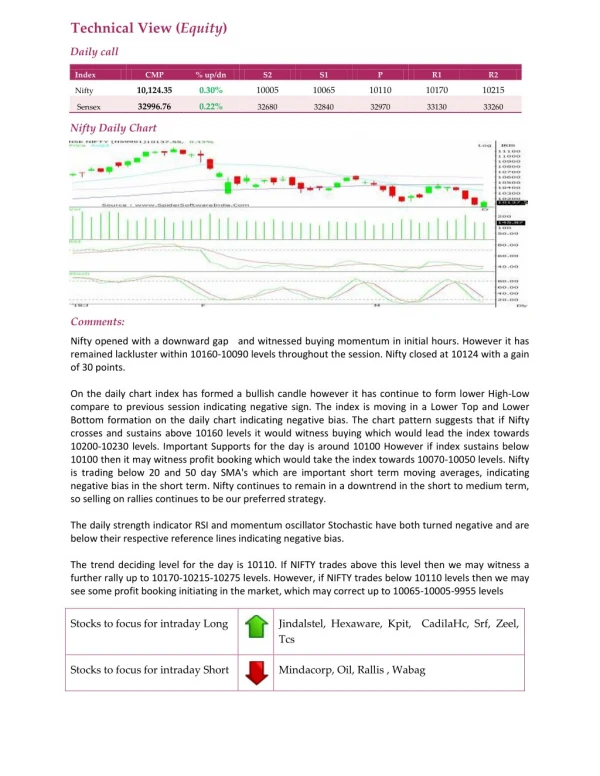
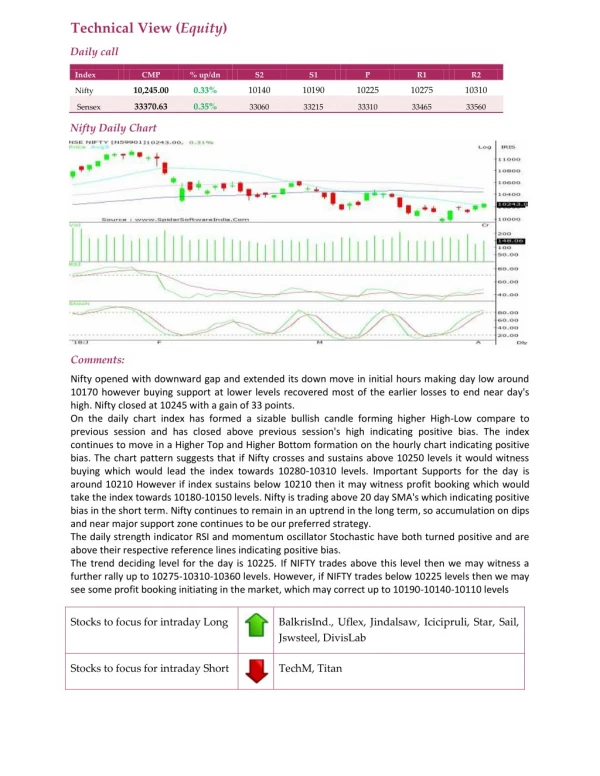
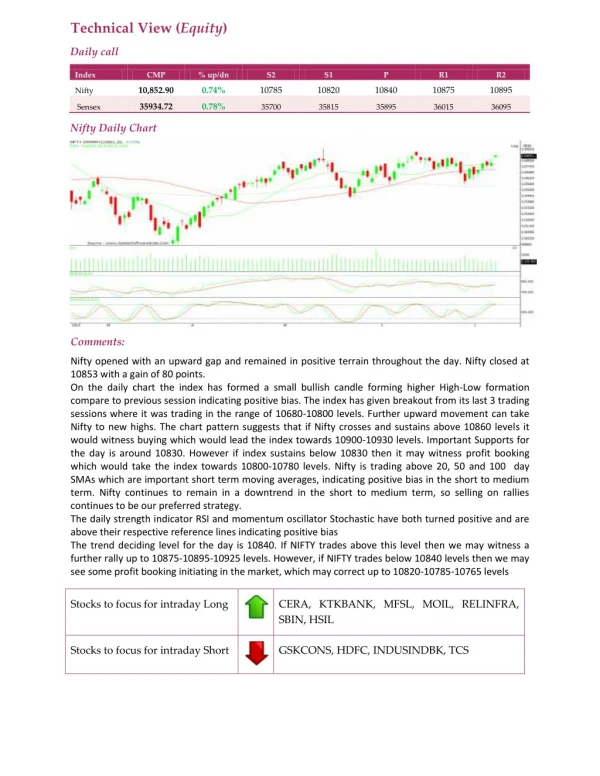
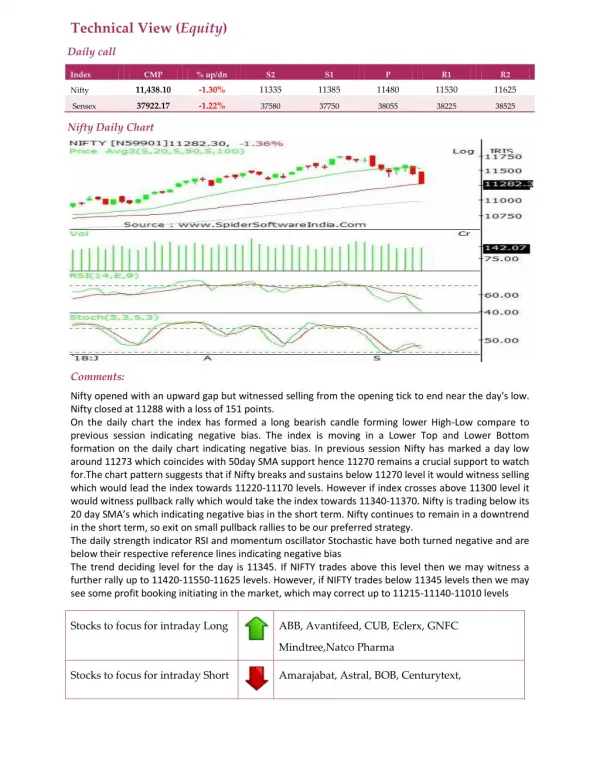
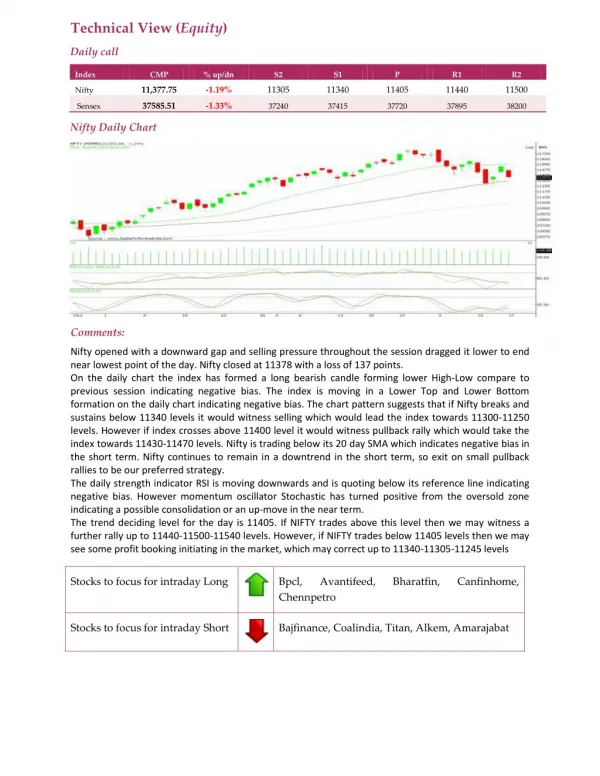
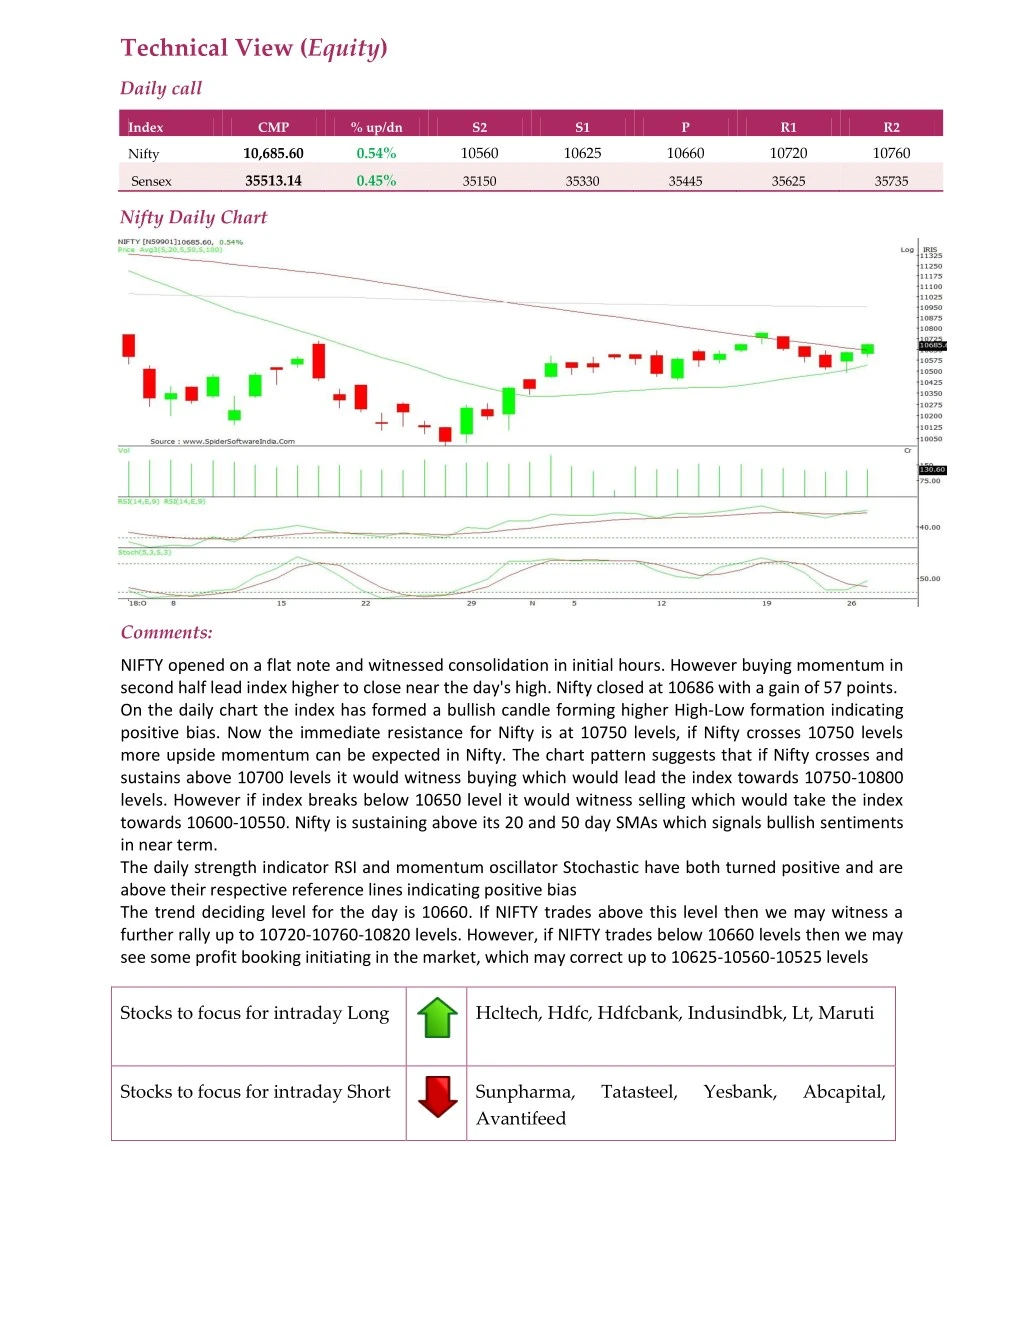
Technical View (Equity) Daily call Index CMP % up/dn S2 S1 P R1 R2 10,685.60 0.54% 10560 10625 10660 10720 10760 Nifty 35513.14 0.45% Sensex 35150 35330 35445 35625 35735 Nifty Daily Chart Comments: NIFTY opened on a flat note and witnessed consolidation in initial hours. However buying momentum in second half lead index higher to close near the day's high. Nifty closed at 10686 with a gain of 57 points. On the daily chart the index has formed a bullish candle forming higher High-Low formation indicating positive bias. Now the immediate resistance for Nifty is at 10750 levels, if Nifty crosses 10750 levels more upside momentum can be expected in Nifty. The chart pattern suggests that if Nifty crosses and sustains above 10700 levels it would witness buying which would lead the index towards 10750-10800 levels. However if index breaks below 10650 level it would witness selling which would take the index towards 10600-10550. Nifty is sustaining above its 20 and 50 day SMAs which signals bullish sentiments in near term. The daily strength indicator RSI and momentum oscillator Stochastic have both turned positive and are above their respective reference lines indicating positive bias The trend deciding level for the day is 10660. If NIFTY trades above this level then we may witness a further rally up to 10720-10760-10820 levels. However, if NIFTY trades below 10660 levels then we may see some profit booking initiating in the market, which may correct up to 10625-10560-10525 levels Stocks to focus for intraday Long Hcltech, Hdfc, Hdfcbank, Indusindbk, Lt, Maruti Stocks to focus for intraday Short Sunpharma, Avantifeed Tatasteel, Yesbank, Abcapital,