Download
1 / 1
10 likes | 27 Vues
Axis Direct presents daily derivatives report presenting recommendations based on technical analysis. For trading in derivatives visit https://simplehai.axisdirect.in/offerings/products/derivatives<br>https://simplehai.axisdirect.in/share-stock-prices/nse/HDFC-Bank-Ltd-4987<br>https://simplehai.axisdirect.in/share-stock-prices/nse/Aurobindo-Pharma-Ltd-4666<br>

E N D
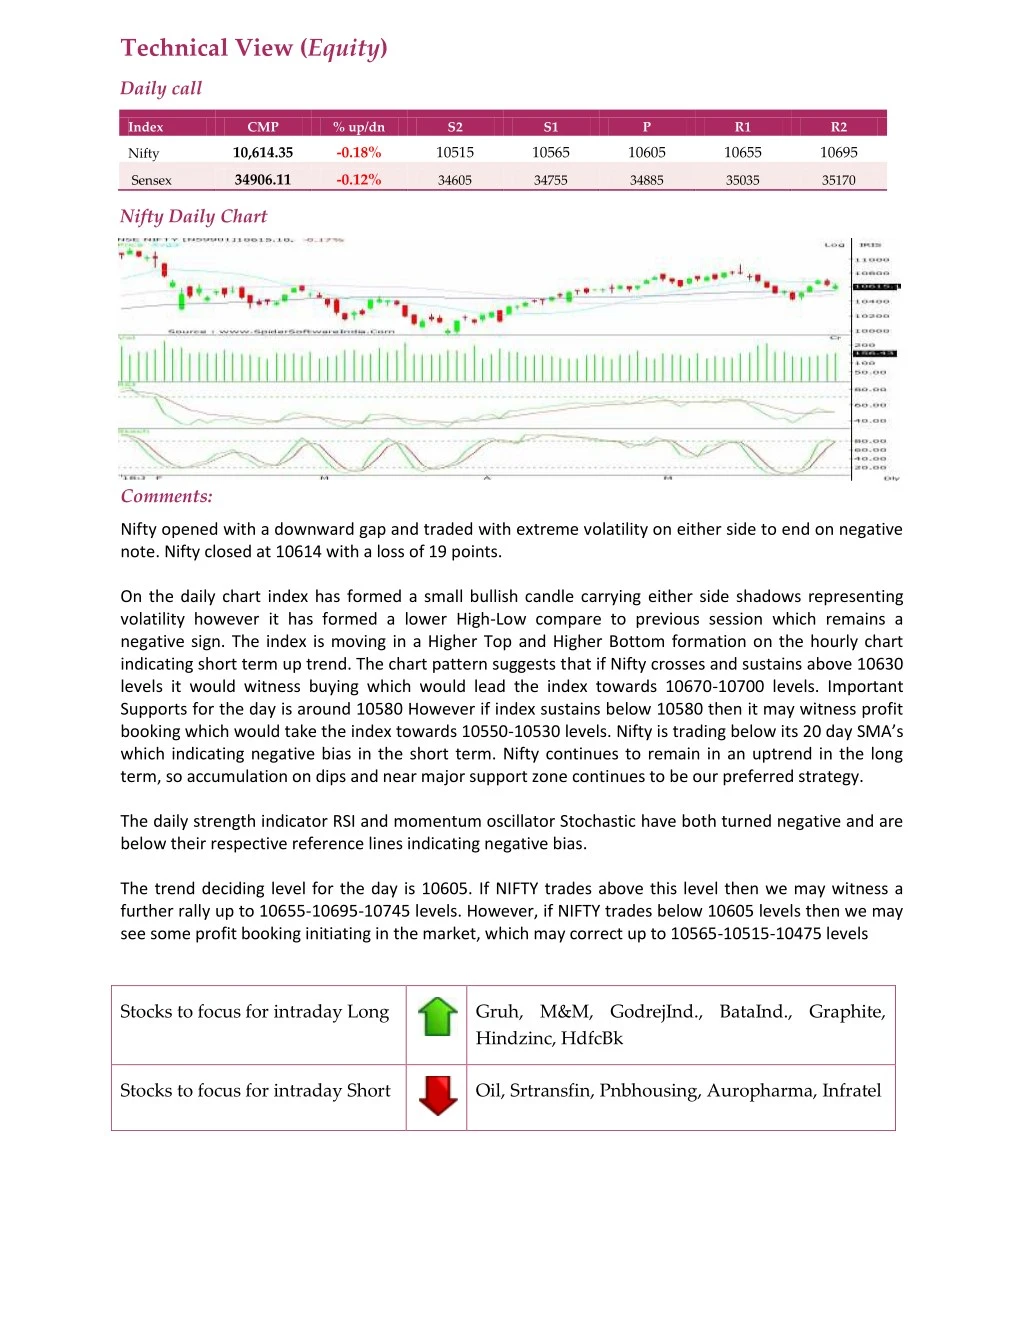
Technical View (Equity) Daily call Index CMP % up/dn S2 S1 P R1 R2 10,614.35 -0.18% 10515 10565 10605 10655 10695 Nifty 34906.11 -0.12% Sensex 34605 34755 34885 35035 35170 Nifty Daily Chart Comments: Nifty opened with a downward gap and traded with extreme volatility on either side to end on negative note. Nifty closed at 10614 with a loss of 19 points. On the daily chart index has formed a small bullish candle carrying either side shadows representing volatility however it has formed a lower High-Low compare to previous session which remains a negative sign. The index is moving in a Higher Top and Higher Bottom formation on the hourly chart indicating short term up trend. The chart pattern suggests that if Nifty crosses and sustains above 10630 levels it would witness buying which would lead the index towards 10670-10700 levels. Important Supports for the day is around 10580 However if index sustains below 10580 then it may witness profit booking which would take the index towards 10550-10530 levels. Nifty is trading below its 20 day SMA’s which indicating negative bias in the short term. Nifty continues to remain in an uptrend in the long term, so accumulation on dips and near major support zone continues to be our preferred strategy. The daily strength indicator RSI and momentum oscillator Stochastic have both turned negative and are below their respective reference lines indicating negative bias. The trend deciding level for the day is 10605. If NIFTY trades above this level then we may witness a further rally up to 10655-10695-10745 levels. However, if NIFTY trades below 10605 levels then we may see some profit booking initiating in the market, which may correct up to 10565-10515-10475 levels Stocks to focus for intraday Long Gruh, M&M, GodrejInd., BataInd., Graphite, Hindzinc, HdfcBk Stocks to focus for intraday Short Oil, Srtransfin, Pnbhousing, Auropharma, Infratel


![Full{90k} W.a.t.c.h ("Samson") [2018] Movie {Online Free}"HD"](https://cdn4.slideserve.com/7787773/full-90k-w-a-t-c-h-samson-2018-movie-online-free-dt.jpg)