Download
1 / 16
160 likes | 267 Vues
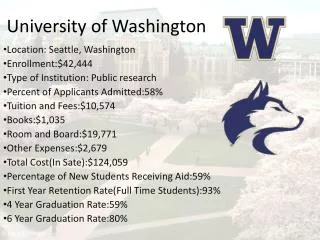
Graduate and Professional Education Summit University of Washington December 7, 2007 Presentation by Ann Daley, Executive Director Higher Education Coordinating Board. Graduate and Professional Education. Graduate and Professional Education fosters: Education (P-20) Innovation

E N D
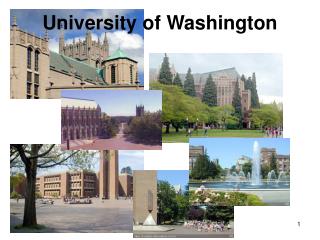
Graduate and Professional Education Summit University of Washington December 7, 2007 Presentation by Ann Daley, Executive Director Higher Education Coordinating Board
Graduate and Professional Education • Graduate and Professional Education fosters: • Education (P-20) • Innovation • Economic dynamism and vitality • Expansion of human knowledge • Science • Health • Technology • Individual opportunity
Washington has not placed high enough priority on graduate education
Washington is last among the GCS in advanced degree production per 1,000 adults 20-34 WA 31% below median Global Challenge States Source: IPEDS
High Demand Graduate and Professional Degree Awards Washington Public Colleges and Universities 1500 1000 Degrees Awarded 500 0 1996-97 1997-98 1998-99 1999-00 2000-01 2001-02 2002-03 2003-04 2004-05 2005-06 Year Stagnant advanced degree production in specific fields
In 2004-05, Washington produced more degrees than it imported – except for graduate and professional degrees 13,850 Graduate or professional degree 10,940 22,229 Bachelors degrees 28,265 1,904 Associate degrees 22,338 14,371 Some college but no degree 4,144 Net In-Migration (Age 22-64) High school diploma Degrees Awarded: 2004-05 Less than a high school 4,139 diploma - 5,000 10,000 15,000 20,000 25,000 30,000 Source: Census, 2005 American Community Survey
Improving these results is especially challenging given that . . . Source: OFM 2007
Challenge: Population is increasing most among groups at greatest risk for dropping out By 2030 more than 37% of our school population will be from low-income and diverse groups Source: OFM 2007
Challenge: The pipeline is leaking . . . Snapshot captures 30% of AA degrees and 41% of BA degrees awarded statewide 2005-2006 95,267 Ninth 82,596 BA 11,778 12th 70,783 AA 6,739 H.S. 38,233 College Completers 18,517 100% 87% 76% Sources: OSPI: K12 Enrollment and Graduation OSPI/SESRC: High School Graduate Follow Study IPEDS: Completions Rate 40% 19%
Pipeline leaks all the way to the end … • The National Council of Graduate Schools reported this year that - on average across the U.S. - just 50 to 60 percent of those who enter doctoral programs complete their degrees. • Source: Graduate Education: The Backbone of American Competitiveness and Innovation, page 22.
Challenge: Educational results in other nations portend a loss of competitive advantage for U.S. and Washington …but the U.S. (and Washington) are standing still 52% 51% 48% 44% 40% 40% 40% 40% 33% 37% 19% 18% 18% 17% Canada Japan Korea Ireland Spain France U.S. WA Age 45-54 with AA or higher Age 25-34 with AA or higher
Draft Preliminary Strategic Master Plan Degree Production Goals for 2018 • Mid-level degree, certificates: • 34,300 annually, an increase of 7,500 degrees annually • Baccalaureate degrees: • 40,200 per year, an increase of 11,600 degrees annually* • Advanced degrees: • 18,300 per year, an increase of 7,100 degrees annually** • * Places Washington near 75th percentile of the current annual degree production by the Global Challenge States. • ** Places Washington near 50th percentile of the current annual degree production by the Global Challenge States.
Robust expansion of graduate degree production will be difficult, both programmatically and fiscally … 2005-06 Cost of Instruction Per FTE Graduate StudentState support plus tuition (operating fees) collections $23,754 $21,552 Dollars Per FTE Graduate Student $13,301 $13,032 $9,782 $7,768 UW WSU CWU EWU TESC WWU (all campuses) (all campuses)
Technology Transfer: One example of the Benefits of Graduate Education
Summary • Washington is last among Global Challenge States in advanced degree production • The U.S. is slipping internationally on educational attainment (with economic competiveness not far behind) • Strategic Master Plan proposes ambitious growth in graduate education • Next Step: Detailed enrollment plans to be developed in 2008