Download
1 / 9
90 likes | 245 Vues
Rachel Harte BME230. Defining the Regulatory Potential of Highly Conserved Vertebrate Non-Exonic Elements. Genomic Non-coding Regions. Significant number of vertebrate genomes available Comparative genomics aids identification of functional regions ~ 97% of human genome is non-coding

E N D
Rachel Harte BME230 Defining the Regulatory Potential of Highly Conserved Vertebrate Non-Exonic Elements
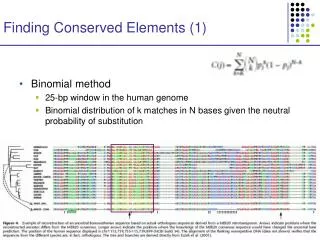
Genomic Non-coding Regions • Significant number of vertebrate genomes available • Comparative genomics aids identification of functional regions • ~ 97% of human genome is non-coding • Ultra-conserved regions identified (Gill Bejerano, 2004) • 481 elements >200bp, 100% conserved between human, mouse and rat • average of 95% and 99% ID with dog and chicken • Non-exonic ultraconserved elements in gene deserts of > 1Mb • 156 genes flanking intergenic ultras tend to be involved in developmental genes • Distal enhancers for these genes? Non-exonic conserved (NECs) regions
Investigating Enhancers in NECs • Alignment nets were used for human-mouse comparisons and for zebrafish (Danio rerio) and Tetraodon nigroviridis comparisons • Sliding window of 50bp and threshold such that 5% of human genome is conserved and about 73% of exons tagged as conserved • NECs filtered of conserved regions of annotated exons, pseudogenes, RNA genes, gene predictions, mRNA, ESTs from any species, annotated repeats and regions mapping to 10 or more genomic locations in mouse • Blastz of human to fish NECs • Blat these regions to the human genome (hg17, May 2004), merge and unique • 4551 regions found • compare to experimentally verified putative enhancers • search for known Transcription factor binding sites
Methods – Enhancer Comparison • Enhancers from literature and provided by researchers • Dach1 enhancer regions (Science, 2003, Nobrega et al.) • chr13 CFTR region elements (Rick Myers group, Stanford) • Vista chr16 elements (Eddy Rubin from Enhancer Browser) • HLXB9, SOX21, PAX6, SHH,KIAA0010 (Woolfe et al., 2005, PLOS) • conserved non-coding regions, Fugu vs. human • Map these to human (hg17) if not already • Results: • Dach1: 8/9 elements intersect with NECs • PLOS elements: 31/32 mapped to hg17 • 4 PAX6, 2 SHH, KIAA0010 and HLXB9 regions mapped
Search for TFBS in NECs • Use Jaspar database of PSSM for TFBS • Bin NECs according to GC content for generation of background sequences • GC content shows normal distribution with mean at around 35% and range 14.91 to 88.06% • PST program used to create a Markov model and emit 50 sequences of 300 bp each for background • dnaMotifFind (Jim Kent): 2nd order Markov model, with PSSM from Jaspar vs NECs • Jaspar has 49 human TFBS
TFBS Distribution in NECs • dnaMotif score: • log odds: ln P(motif | PSSM) / P(motif | background) • Distribution of TFBS with length of NEC: • skewed to left with highest counts in 0.005-0.0075 TFBS / base • 1040 elements have TFBS and 316 have > 1 • Improbizer: • search for consensus sequences in the sets of putative enhancers • control runs of 100 to compare score
Consensus Sequence Identification • Using a control set of sequences used by Stanford in enhancer experiments • 10.7771 ACGTCGC, 11.1520 GCATTTGT • these are barely significant compared to control runs • do not intersect with TFBS found by rVista2 • Motif 1 in Dc3, 6 and 7, motif 2 in Dc6, 7 and 8 • Control set – similar GC content (30-35%) • 15.0389 TTTCCTATTTCGCTT, motif 1, Dc6 and Dc7 • 13.8802 GCTCCACGCTTCCACCT, motif 2, Dc6, 7 and 8 • score higher than control runs. Dc7 overlap - MEIS1
Future Work • Search for TFBS for NECs using Transfac • Take the NECs and create a model using PST, emit sequences and use in TFBS search as comparison • Use this to help with fine tuning dnaMotifFind • Search in NECs for consensus motifs found by Improbizer • More investigation of TFs from rVista and how these map to NECs • Map NECs and find nearest genes • GO annotation - function
Thank You • Gill Bejerano (PST) • Jim Kent (Improbizer, dnaMotifFind,MotifMatcher) • UCSC Browser Staff