Download
1 / 23
310 likes | 490 Vues
TRACTOR PERFORMANCE (EMPIRICAL). AGUS HARYANTO VISIT: http://www.energimasadepan.wordpress.com. ENGINE PERFORMANCE MODELLING. Fuel consumption model by Huynh and Brown (1981): FC = A.Q + B.N 2

E N D
TRACTOR PERFORMANCE (EMPIRICAL) AGUS HARYANTO VISIT: http://www.energimasadepan.wordpress.com
ENGINE PERFORMANCE MODELLING Fuel consumption model by Huynh and Brown (1981): FC = A.Q + B.N2 A and B are constants which can be determined if the fuel consumption, engine speed and power are known for two points on the performance characteristic for the engine.
EXAMPLE Estimate the fuel consumption for the Farmland tractor for engine power, Q = 15 kW and engine speed, N = 1600 rpm. Compare the answer with the measured value as shown in Figure 3.4. For Q = 15 kW and N = 1600 rpm, from Equation 5.2, FC = 0.19 x 15 + 4.9 x 10-7 x 16002 = 2.85 + 1.25 = 4.1 kg/hr From Figure 3.4 for Q = 15 kW and N = 1600, SFC = 250 g/kWhr. Measured FC = 250 x 15 = 3.8 kg/hr The predicted value is within 8% of the measured value which is about the accuracy that can be expected with the empirical approach.
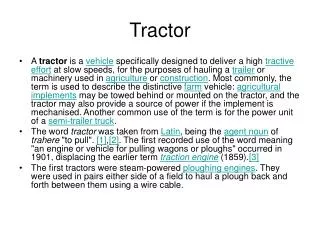
TRACTIVE PERFORMANCE MODELLING • Parameter: 'cone index' (in theoretical method the parameter is sinkage, z) • Cone index (CI) is based on the force (kN) to push a circular cone (base area = 0.5 in2 = 322 mm2) into the soil at a constant speed of 72 in/min (30 mm/sec) (ASAE, 1998). Cone index is given by: • Depend on the soil texture, moisture content • It is a measure of soil 'strength' and deformability • It is correlate to tractive force and rolling resistance.
Mobility number (M) • It is a measure of the ability of tire to move and correlate to Coef. of Rolling Resistance. M = mobility number CI = cone index, kPa W = weight on tire, kN b, d, h = width, diameter, tire section height, m δ = tire deflection under weight W, m
Prediction of performance a. Coefficient of Rolling Resistance () = 0.049 + (0.287/M) Fig. 5.2 • Rolling resistance (R) is calculated as the product of this coefficient and the dynamic weight on the tire (Wd): R = Wd.
Prediction of performance (Cont’d) b. Tractive coefficient
Prediction of performance (Cont’d) c. Drawbar pull P = Wdr ψ − Wdf ρf • Substitution: Where: Wdr = Wr + P (y'/x) Wdf = Wf + P (y'/x) reminder: Ψ is a function of CI where: y' = drawbar height x = location of center of gravity
Prediction of performance (Cont’d) d. Drawbar power DB power = P. V = P Vo (1-i) = P π D Ne q (1-i)
Prediction of performance (Cont’d) d. Tractive efficiency (Eq. 2-10)
Tugas • Kerjakan soal # 8.1 dan 8.5 (waktu 2 minggu dari sekarang, tanpa perpanjangan, tanpa kompromi). • Good luck and ……….. Have a nice break