Download
1 / 1
10 likes | 175 Vues
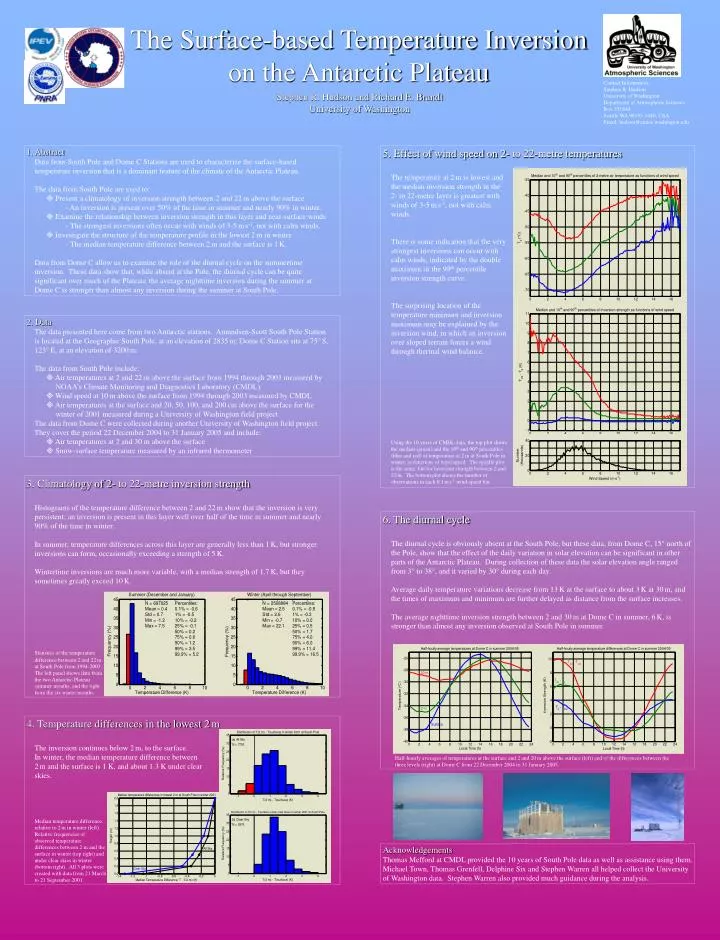
5. Effect of wind speed on 2- to 22-metre temperatures The temperature at 2 m is lowest and the median inversion strength in the 2- to 22-metre layer is greatest with winds of 3-5 m s -1 , not with calm winds. There is some indication that the very strongest inversions can occur with

E N D
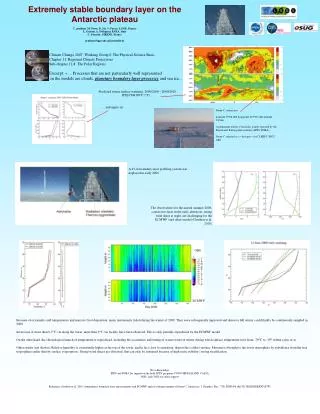
5. Effect of wind speed on 2- to 22-metre temperatures The temperature at 2m is lowest and the median inversion strength in the 2- to 22-metre layer is greatest with winds of 3-5ms-1, not with calm winds. There is some indication that the very strongest inversions can occur with calm winds, indicated by the double maximum in the 90th percentile inversion strength curve. The surprising location of the temperature minimum and inversion maximum may be explained by the inversion wind, in which an inversion over sloped terrain forces a wind through thermal wind balance. Using the 10 years of CMDL data, the top plot shows the median (green) and the 10th and 90th percentiles (blue and red) of temperature at 2m at South Pole in winter, as functions of wind speed. The middle plot is the same, but for inversion strength between 2 and 22m. The bottom plot shows the number of observations in each 0.1ms-1 wind-speed bin. 3. Climatology of 2- to 22-metre inversion strength Histograms of the temperature difference between 2 and 22m show that the inversion is very persistent; an inversion is present in this layer well over half of the time in summer and nearly 90% of the time in winter. In summer, temperature differences across this layer are generally less than 1K, but stronger inversions can form, occasionally exceeding a strength of 5K. Wintertime inversions are much more variable, with a median strength of 1.7K, but they sometimes greatly exceed 10K. Statistics of the temperature difference between 2 and 22m at South Pole from 1994-2003. The left panel shows data from the two Antarctic-Plateau summer months, and the right from the six winter months. 6. The diurnal cycle The diurnal cycle is obviously absent at the South Pole, but these data, from Dome C, 15° north of the Pole, show that the effect of the daily variation in solar elevation can be significant in other parts of the Antarctic Plateau. During collection of these data the solar elevation angle ranged from 3° to 38°, and it varied by 30° during each day. Average daily temperature variations decrease from 13K at the surface to about 3K at 30m, and the times of maximum and minimum are further delayed as distance from the surface increases. The average nighttime inversion strength between 2 and 30m at Dome C in summer, 6K, is stronger than almost any inversion observed at South Pole in summer. Half-hourly averages of temperatures at the surface and 2 and 20m above the surface (left) and of the differences between the three levels (right) at Dome C from 22 December 2004 to 31 January 2005. 4. Temperature differences in the lowest 2m The inversion continues below 2m, to the surface. In winter, the median temperature difference between 2m and the surface is 1 K, and about 1.3 K under clear skies. Median temperature difference relative to 2m in winter (left). Relative frequencies of observed temperature differences between 2 m and the surface in winter (top right) and under clear skies in winter (bottom right). All 3 plots were created with data from 21 March to 21 September 2001. The Surface-based Temperature Inversion on the Antarctic Plateau Contact Information: Stephen R. Hudson University of Washington Department of Atmospheric Sciences Box 351640 Seattle WA 98195-1640; USA Email: hudson@atmos.washington.edu Stephen R. Hudson and Richard E. Brandt University of Washington 1. Abstract Data from South Pole and Dome C Stations are used to characterize the surface-based temperature inversion that is a dominant feature of the climate of the Antarctic Plateau. The data from South Pole are used to: Present a climatology of inversion strength between 2 and 22m above the surface - An inversion is present over 50% of the time in summer and nearly 90% in winter. Examine the relationship between inversion strength in this layer and near-surface winds - The strongest inversions often occur with winds of 3-5ms-1, not with calm winds. Investigate the structure of the temperature profile in the lowest 2m in winter - The median temperature difference between 2m and the surface is 1K. Data from Dome C allow us to examine the role of the diurnal cycle on the summertime inversion. These data show that, while absent at the Pole, the diurnal cycle can be quite significant over much of the Plateau; the average nighttime inversion during the summer at Dome C is stronger than almost any inversion during the summer at South Pole. 2. Data The data presented here come from two Antarctic stations. Amundsen-Scott South Pole Station is located at the Geographic South Pole, at an elevation of 2835m; Dome C Station sits at 75°S, 123°E, at an elevation of 3200m. The data from South Pole include: Air temperatures at 2 and 22 m above the surface from 1994 through 2003 measured by NOAA’s Climate Monitoring and Diagnostics Laboratory (CMDL) Wind speed at 10m above the surface from 1994 through 2003 measured by CMDL Air temperatures at the surface and 20, 50, 100, and 200cm above the surface for the winter of 2001 measured during a University of Washington field project The data from Dome C were collected during another University of Washington field project. They cover the period 22 December 2004 to 31 January 2005 and include: Air temperatures at 2 and 30 m above the surface Snow-surface temperature measured by an infrared thermometer Acknowledgements Thomas Mefford at CMDL provided the 10 years of South Pole data as well as assistance using them. Michael Town, Thomas Grenfell, Delphine Six and Stephen Warren all helped collect the University of Washington data. Stephen Warren also provided much guidance during the analysis.