Download

1 / 29
300 likes | 494 Vues
Compensating Wage Differentials: “pay is not all that matters” . Grass grows, birds fly, waves pound the sand. It’s just a job. . I beat people up. . —Mohammad Ali.

E N D
Compensating Wage Differentials: “pay is not all that matters” Grass grows, birds fly, waves pound the sand. It’s just a job. I beat people up. —Mohammad Ali Florida Trade Service “has been through more than 50 employees, some of whom bailed out after the first job.” What service does it sell? Body removals and death scene restorations
Ch. 8: COMPENSATING WAGE DIFFERENTIALS AND LABOR MARKETS • A compensating wage differential • an increment in wages required to attract workers into a job with an undesirable working condition. • Theory of Compensating differences. • Assumptions on Employee Side. • workers maximize utility—”pay is not all that matters” • workers know job attributes and competing job offers. • workers are mobile.
Every voyage began with assembling a crew. In May 1876, the small 106-foot bark Bartholomew Gosnold signed a crew of 31 men for its next voyage from New Bedford. Less than half were from the United States; the rest were from Portugal, England, Ireland, Germany, France, and Scotland; two were listed as blacks. The oldest crewman was in his forties; the youngest was sixteen.
Ch. 8: COMPENSATING WAGE DIFFERENTIALS AND LABOR MARKETS • A compensating wage differential • an increment in wages required to attract workers into a job with an undesirable working condition. • Theory of Compensating differences. • Assumptions on Employee Side. • workers maximize utility. • workers know job attributes and competing job offers. • workers are mobile.
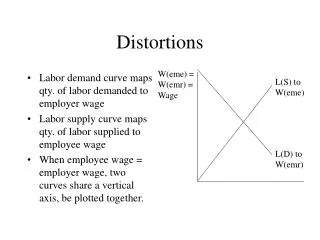
Wage U0 0 Probability of Death (r) 2.5 3.5 Indifference Curves Relating the Wage and the Probability of Death at Sea Compensating wage differential for an Arctic Voyage wA wA– wNA wNA w0 wage of a perfectly safe job Arctic Non-Arctic
Employee preferences • Indifference curves to the NW represent higher levels of utility. • A flatter indifference curve reflects a greater willingness to accept money to put up with additional risk (less risk averse)
Wage U0 0 Probability of Death (r) 2.5 3.5 Indifference Curves Relating the Wage and the Probability of Death at Sea wage of a perfectly safe job Arctic Non-Arctic
Wage UC UB UA Indifference Curves for Three Types of Workers Different workers have different preferences for risk. Worker A is very risk-averse. Worker C does not mind risk as much. Probability of Death (r)
Wage p0 = 0 Q R Probability of Death (r) Isoprofit Curves An isoprofit curve gives all the risk-wage combinations that yield the same profits. Because it is costly to produce safety, a firm offering risk level r* can make the workplace safer only if it reduces wages (while keeping profits constant), so that the isoprofit curve is upward sloping. Higher isoprofit curves yield lower profits. Arctic Whaling Company Wager=3.5 3.5
Suppose the Rotch Whaling Company (RWC) paid 10 thousand sailors a wage of $8 per month to hunt whales. Whaling voyages were dangerous, leading to a mortality rate of 3 sailors per hundred. Suppose the market for whale oil was competitive and that RWC earned zero economic profits. Figure 1 illustrates one point (W) on RWC’s iso-profit curve. Suppose RWC could have purchased lifeboats (L) and safety gear (G) to reduce the risk of whaling. The isoquant in figure 2 illustrates the combinations of lifeboats and safety gear that would have reduced the death rate of whalers from 3 deaths per 100 whalers peryear to 2 deaths per year. William Rotch Jr. (1759-1850) built ships, supplies, warehouses, and wharves for his whaling fleet. Suppose a barrel of G costs $100 per month in foregone whale oil and a lifeboat costs $200 per month. Illustrate the cost minimizing combination of G and L that would have reduced the death rate from 3 to 2 deaths per year. If RWC reduced risk in this way, it would have needed to pay lower wages to keep economic profits constant at zero. Plot the combination of the lower death rate and lower wage that lies on the iso-profit curve. Label this point X. Suppose RWC decided to reduce risk even further by increasing expenditures on safety by the same amount that it spent in moving from W to X. Suppose this would have only reduced the death rate from 2 deaths per year per 100 whalers to 1.5 deaths per year because of diminishing returns. Label the corresponding point on the iso-profit curve as Z. Sketch the iso-profit curve.
Figure 1. Deriving the Iso-Profit Curve of the Rotch Whaling Company Wage ($ per month) W Risk (deaths per 100 sailors)
Figure 2. Isoquants and Iso-Expenditure Curves of Safety Lifeboats (#) = Q = Δr = 2 – 3 deaths per 100 Safety Gear (# of barrels)
Figure 2. Isoquants and Iso-Expenditure Curves of Safety Lifeboats (#) = Q = Δr = 2 – 3 deaths per 100 Safety Gear (# of barrels)
Figure 1. Deriving the Iso-Profit Curve of the Rotch Whaling Company Wage ($ per month) W X Z Risk (deaths per 100 sailors)
Figure 1. Deriving the Iso-Profit Curve of the Rotch Whaling Company Wage ($ per month) W X Z Risk (deaths per 100 sailors)
Assumptions on Employer Side. • Firms maximize profits. • Iso-profit curves show combinations of wage and risk that yield same profit. • Iso-profit curves further to the SE represent higher levels of profits. • A steeper iso-profit curve indicates that it is more costly to eliminate risk.
Figure 3. Iso-Profit Curves of the RWC by Destination, Arctic (A) & Non-Arctic (N) Wage ($ per month) Risk (deaths per 100 sailors)
Wage UC UB PB pZ pY Probability of Death wA wA– wNA wNA
U0 Wage Probability of Death Suppose the government of Massachusetts was considering requiring whaling companies to adopt safety measures that would reduce the fatality rate of Arctic to the levels of non-Arctic ones. Under what assumptions would this increase efficiency and under what assumptions would it erode efficiency. Illustrate and explain your answer. U1 p0 = 0 wA wNA 2.5 3.5
Wage U0 Probability of Death U1 p0 = 0 wA No Reg A B wA Reg wNA = R 2.5 3.5
Blubber heads… Green… Contracts using specified the whaling ground (Arctic versus non-Arctic) New Bedford newspapers reported on the average catch and length of voyage of all vessels returning to New Bedford Losses of vessels was big news
10723 labor contracts of unskilled seamen over the years 1840-1858 Equals one if (hunting ground) destination is Monthly wage (mean = $8) Calculated using ships returning in year t-1 from the destination whaling ground Wage premium holding the financial risk and voyage length constant.
In the mid-19th century, whaling vessels from New Bedford, Massachusetts sailed all over the world in search of sperm and bowhead whales. While sperm whales provided higher quality oil, only bowheads provided whalebone (a flexible bonelike screen) which was an important input into a variety of products ranging from corsets to umbrellas. The two types of whales were found in different areas of the World's oceans: bowheads were found primarily in the Arctic while sperm whales were found in the Atlantic, Indian and Pacific Oceans. Whaling was a risky occupation, particularly for sailors working in the Arctic. Over the years 1816 to 1905, 3.5 percent of the Arctic fleet was lost each year along with 2.5 percent of the non-Arctic fleet. Economic historians have estimated that the annual earnings of unskilled sailors on whaling vessels was roughly $2,870 (2008 $) for non-Arctic voyages and $3,125 for Arctic voyages, holding the length of voyages and financial risk of voyages constant. What is an estimate of the value that unskilled sailors placed on a statistical life?
. • For our estimates of compensating wage differentials to be valid….. • workers maximize utility. • workers know job attributes and competing job offers. • workers are mobile. • Held other factors constant…
wA- wNA S P D Number of Arctic Seamen (AS) Determining the Market Compensating Differential Market for Arctic Unskilled Seamen The supply curve slopes up because as the wage gap between the Arctic voyages and non-Arctic ones increases, more and more whalers are willing to sign on for the Arctic voyages. The demand curve slopes down because … The market compensation differential equates supply and demand, and gives the premium required to attract the last whaler to sign on to the Arctic voyage. (wA– wNA)e ASe
Empirical Tests of Compensating Wage Differentials Theory must be applicable (negative results where they is little possible of getting positive ones aren’t very interesting or publishable.) Workers have good information—on the characteristics of jobs and the alternatives. Workers have mobility—they have the opportunity to choose other alternatives Press gangs (impressment) Detailed data must be available Individual Characteristics: age education, union status, etc. Job Characteristics: attractive and disagreeable aspects of jobs—it is often difficult to measure characteristics such as the riskiness of a job.