Download
1 / 1
20 likes | 1.23k Vues
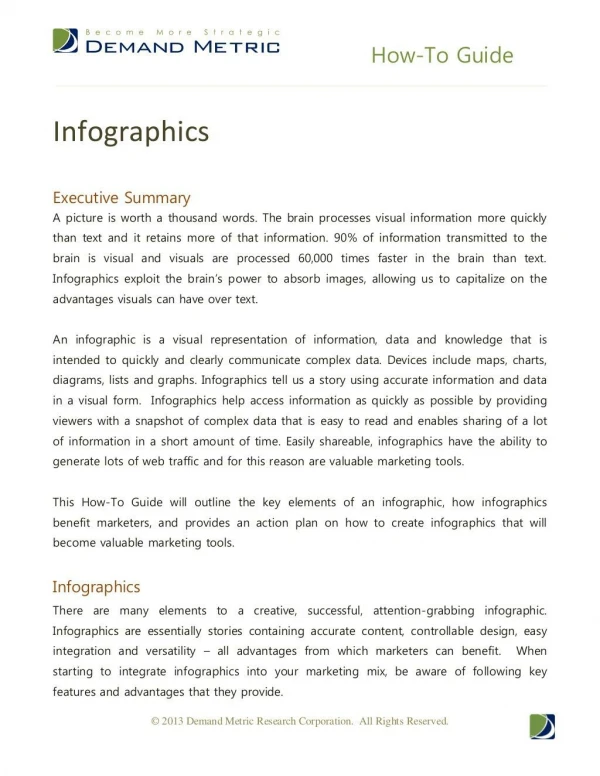
Information graphics or infographics are graphic visual representations of information, data or knowledge. These graphics present complex information quickly and clearly, such as in signs, maps, journalism, technical writing, and education. With an information graphic, computer scientists, mathematicians, and statisticians develop and communicate concepts using a single symbol to process information. <br><br>With the trend of using the internet to convey information to millions of people worldwide, it also becomes a challenge on how you can effectively communicate to the people with your contents. Making one’s content eye-catching and easy to understand is not an easy task. You need to dig deeper into a topic and look for ways to present it in a manner that you could outshine your competitors. It is not just you who have thought of writing or presenting a particular topic. There are thousands of people who are also posting the same. The challenge is for you to make it unique and more attractive. This is where infographics come in. Infographics are visual representations of information, data or knowledge. It is an important tool in teaching, in business, in giving inspiration and in presenting information. It is one of the most powerful ways to communicate with complex data.

E N D
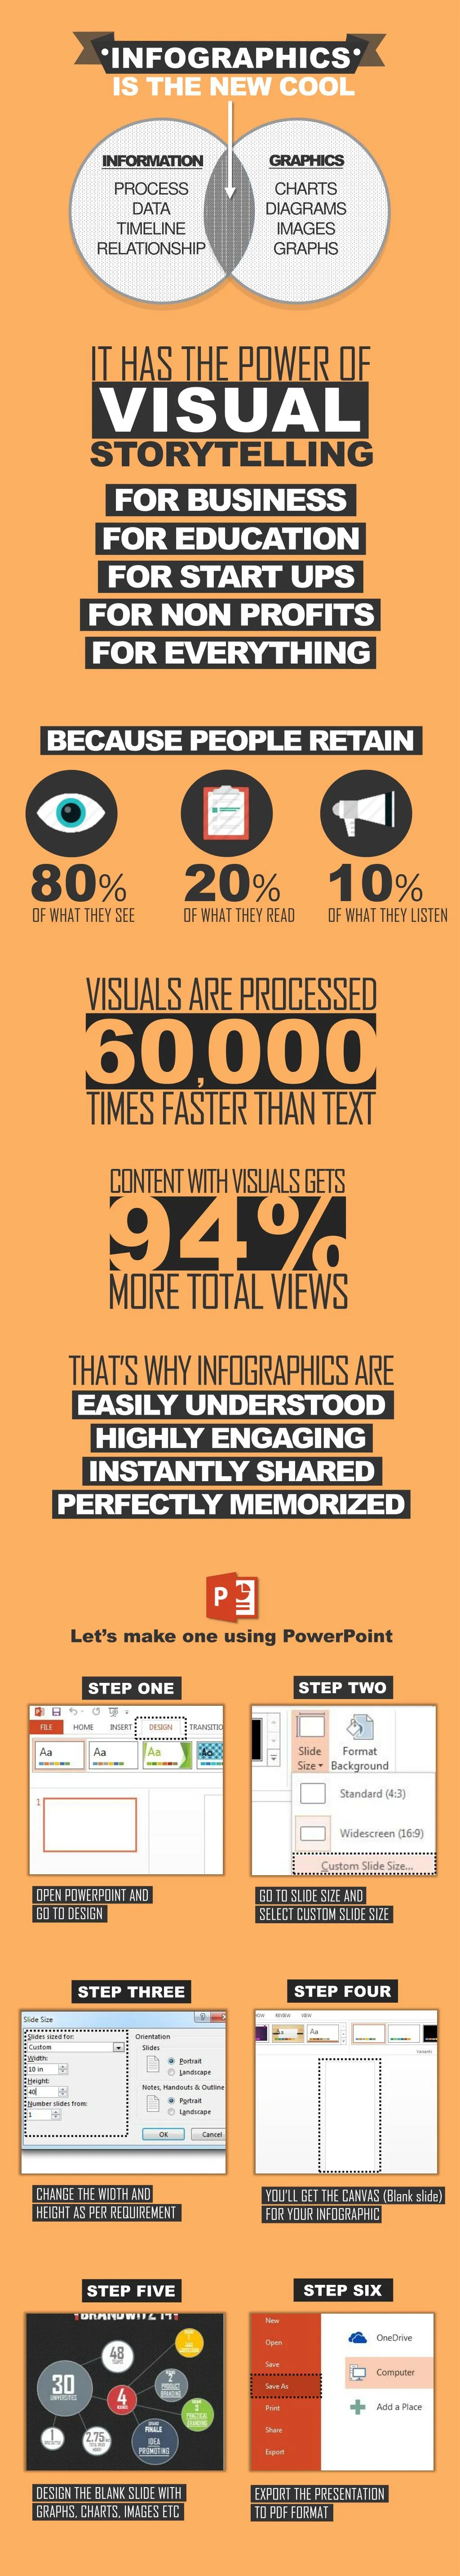
INFOGRAPHICS IS THE NEW COOL GRAPHICS CHARTS DIAGRAMS IMAGES GRAPHS INFORMATION PROCESS DATA TIMELINE RELATIONSHIP IT HAS THE POWER OF VISUAL STORYTELLING FOR BUSINESS FOR EDUCATION FOR START UPS FOR NON PROFITS FOR EVERYTHING BECAUSE PEOPLE RETAIN 80% OF WHAT THEY SEE 20% 10% OF WHAT THEY READ OF WHAT THEY LISTEN VISUALS ARE PROCESSED 60,000 TIMES FASTER THAN TEXT 94% MORE TOTAL VIEWS CONTENT WITH VISUALS GETS THAT’S WHY INFOGRAPHICS ARE EASILY UNDERSTOOD HIGHLY ENGAGING INSTANTLY SHARED PERFECTLY MEMORIZED Let’s make one using PowerPoint STEP TWO STEP ONE OPEN POWERPOINT AND GO TO DESIGN GO TO SLIDE SIZE AND SELECT CUSTOM SLIDE SIZE STEP FOUR STEP THREE CHANGE THE WIDTH AND HEIGHT AS PER REQUIREMENT YOU’LL GET THE CANVAS (Blank slide) FOR YOUR INFOGRAPHIC STEP SIX STEP FIVE DESIGN THE BLANK SLIDE WITH GRAPHS, CHARTS, IMAGES ETC EXPORT THE PRESENTATION TO PDF FORMAT