Download
1 / 106
1.07k likes | 2.31k Vues
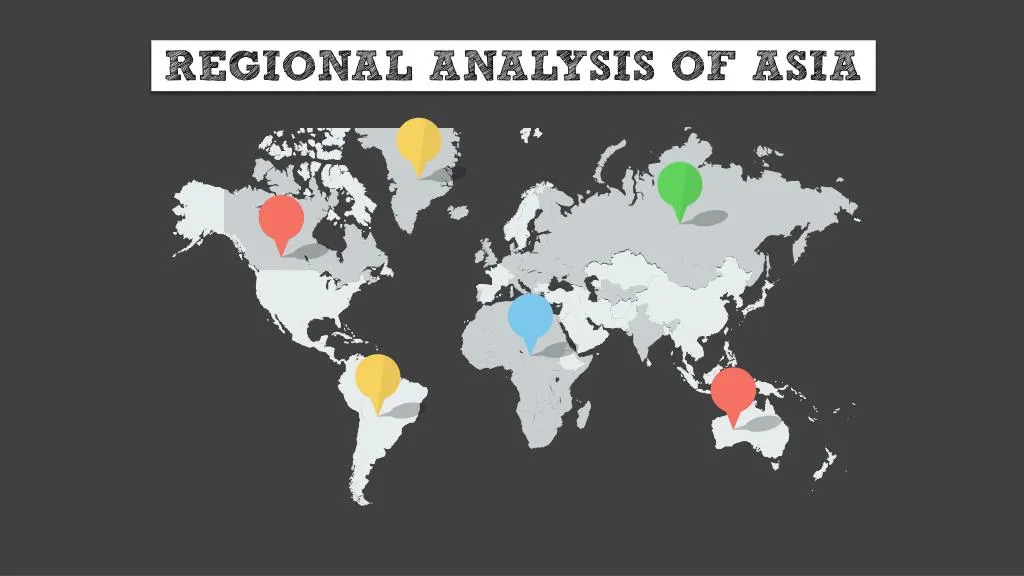
This regional analysis reviews progress in the Asia-Pacific region towards achieving the expected outcomes. The presentation gives detailed idea about all the countries through a rigorous PESTEL analysis.

E N D
ASIA 48.5 COUNTRIES
ASIA 49 COUNTRIES
ASIA 60% POPULATION
ASIA 28% GDP CONTRIBUTION GDP (US$) Continents Percentage GDP Europe 24.4 trillion 34% North America 20.3 trillion 28% Asia 18.5 trillion 26% South America 4.2 trillion 6% Africa 2.6 trillion 4% Oceania 1.8 trillion 2% Antarctica N/A -
ASIA 4 Billionaire cities are in Asia 10 OUT OF
ASIA 7 Largest cities are in Asia10 OUT OF
DIVISIONof the countries BOTTOM TIER MIDDLE TIER TOP TIER HDI 0.65 – 0.75 HDI > 0.75 HDI < 0.65 Source: HDI 2013 as per UNDP
Afghanistan] Yemen Myanmar Pakistan Nepal Bangladesh Lao PDR Bhutan Cambodia India Tajikistan Timor Kyrgyzstan Vietnam Iraq 0.468 0.500 0.524 0.537 0.540 0.558 0.569 0.584 0.584 0.586 0.607 0.620 0.628 0.638 0.642 Syria 0.658 0.660 0.661 0.684 0.686 0.698 0.698 0.698 0.719 0.722 0.730 0.744 0.745 0.747 0.749 0.750 Kazakhstan Turkey Lebanon Malaysia Russia Oman Kuwait Bahrain UAE Saudi Arabia Republic of Cyprus Qatar Brunei Darussalam Israel Japan South Korea 0.754 0.759 0.765 0.773 0.778 0.783 0.814 0.815 0.827 0.836 0.845 0.851 0.852 0.888 0.890 0.891 Philippines Uzbekistan Indonesia Palestine Maldives Mongolia Turkmenistan China Thailand Armenia Georgia Jordan Azerbaijan Iran Sri Lanka
ASIA OLITICAL ESTLE
FACTORS considered Types of government Absolute Monarchy Constitutional Monarchy Republic Theocracy
FACTORS considered Corruption Lower the value, higher the corruption Corruption perception index Transparency international
FACTORS considered Freedom of press Not free (0 to 30); Partly Free (31 to 60); Free (61 to 100) Freedom of the press report 2014 Freedom House
BOTTOM TIER Type of Government: • Laos and Vietnam: Republic, but singleparty dominated •Bhutan and Cambodia: Constitutionalmonarchy •11 other countries follow either Presidential or Parliamentary Republic
BOTTOM TIER Corruption Global Average CPI: 43 • Average CPI: 27 •136thposition out of 176 •Worst position: Afghanistan(CPI of 8) •Bangladesh’sCPI: 27
BOTTOM TIER Global Average: 48 (Partly Free) Freedom of the Press • There is no country that is “FREE” •Average: 65 •Nepal, Bangladesh, Bhutan, India and Timor are “PARTLY FREE” •10 others are “NOT FREE” •Worst position: Laosand Vietnam (scores: 84)
MIDDLE TIER Type of Government: • Presidential Republic and Theocracy in Iran •Military Regime since May, 2014 in Thailand •Communist Party as government in China • Constitutional monarchy in Jordan • 12others: Republic (Presidential or Parliamentary)
MIDDLE TIER Global Average CPI: 43 Corruption • Average CPI: 32 •114thposition out of 176 •Worst position: Syriaand Uzbekistan(CPI of 17)
MIDDLE TIER Global Average: 48 (Partly Free) Freedom of the Press • There is no country that is “FREE” •Average: 70 •Philippines, Indonesia, Maldives, Mongolia and Georgiaare “PARTLY FREE” •11 others are “NOT FREE” • Worst performance: Uzbekistan, Turkmenistan, Syriaand Iran
TOP TIER Type of Government: • Oman, Saudi Arabia, Qatar and Brunei have absolute monarchy •Malaysia, Kuwait, Bahrain, UAE, Japan have constitutionalmonarchy •No SingleParty Republic
TOP TIER Global Average CPI: 43 Corruption • Average CPI: 53 •49thposition out of 176 •Highest: Singapore(CPI is 83) is 5thin the world
TOP TIER Global Average: 48 (Partly Free) Freedom of the Press • Only one “FREE” country is Japan •Average: 61 •SouthKorea, Israel, Kuwaitand Lebanonare “PARTLY FREE” •11 others are “NOT FREE” • Worst performance: Bahrainand Kazakhstan
ASIA CONOMICAL P STLE
FACTORS considered 1. GDP Growth Rate • Source: World Bank 2013 2. Per Capita GDP • Source: World Bank 2013 3. Inflation Rate • Source: Trading Economics 2014 4. Unemployment Rate • Source: World Bank 2012
BOTTOM TIER GDP Growth Rate: • Average GDP Growth rate 2011 to 2013 is 5.9% •Constant GDP over these years: Bangladesh (6.5%), Laos (8.1%), Cambodia (7.3%) •Decreasing growth rates: Iraq, Timor •-15.1% in Yemen in 2011 due to reduction in oil production •-0.1% in Kyrgyzstan in 2012 due to reduction in gold production
BOTTOM TIER Global Average: $10,513 Per Capita GDP • Average Per Capita GDP: $1,705 •Lowest Nepal, Afghanistan, Bangladesh •But among these 3Bangladesh is the best off •That of Nepal and Afghanistan decreasedin 2013
BOTTOM TIER Inflation Rate: Global Average: 3.91% • Average inflation rate: 5.88% •Lowest in Timor (0%) •Highest in Nepal and Bhutan (9.45%) •Bangladesh: 6.91%
BOTTOM TIER Unemployment Rate: Global Average: 8.4% • Average unemployment rate: 6.13% •Double digits: Yemen, Tajikistan, Iraq •Reason for Yemen: Undergoing consequences of revolution in 2011 •Bangladesh: 4.5% (very good)
MIDDLE TIER GDP Growth Rate: • Average GDP Growth rate 2011 to 2013 is 6.3% (highest among all tiers) •Constant GDP over these years: Uzbekistan (8.2%), Indonesia (6.2%), Jordan (7.3%) •Most number of double digit growths: Mongolia, Turkmenistan; but their rates declining •Reason for Mongolia: their Coal export is declining
MIDDLE TIER Per Capita GDP Global Average: $10,513 • Average Per Capita GDP: $4,675 •Increased from Bottom Tier •None of them are below 3digits •Lowest is in Uzbekistan: $1,878
MIDDLE TIER Inflation Rate: Global Average: 3.91% • Average inflation rate: 4.74% •Lowest in Armenia (0.8%) •Double digit inflations: Iran, Syria, Mongolia •Reason for Iran: Multi tier exchange rate system
MIDDLE TIER Unemployment Rate: Global Average: 8.4% • Average unemployment rate: 9.99% (highest amongst the tiers) •Highest in Palestine (23%) and Armenia (18.5%) •Reason for Armenia: Very high wealth gap
TOP TIER GDP Growth Rate: • Average GDP Growth rate 2011 to 2013 is 3.9%(lowest among all tiers) •Biggest reductions: Qatar and Saudi Arabia (oil dependency) •Example of increasing GDP growth rate: Bahrain (due to a very strong financial industry)
TOP TIER Global Average: $10,513 Per Capita GDP • Average Per Capita GDP: $31,997 •Highest: Qatar $93,352 (number 1 in the world, expected to double by 2025, due to low cost of gas production and the FIFA world cup) •Second highest: Singapore $55,182 (number 3 in the world)
TOP TIER Inflation Rate: Global Average: 3.91% • Average inflation rate: 2.96% •Lowest in Brunei (-0.3%) •Highest in Russia 9.54% (most recent reason: ban on Western food import)
TOP TIER Unemployment Rate: Global Average: 8.4% • Average unemployment rate: 5.4% (lowest among tiers) •No country with double digit unemployment rate •Lowest unemployment in Qatar (0.6%) •Reason for Qatar: Runs on expatriates (94% of working population expatriates as of 2012)
ASIA OCIAL PE TLE
INDICATORS CONSIDERED • Population under poverty Line • Rural Population with Water Access • Urban Population with Water Access • Urban Population with Sanitation Access • Ratio of Female to Male Primary Enrollment • Ratio of Female to Male Secondary Enrollment • Ratio of Female to Male Tertiary Enrollment • Life Expectancy at Birth in years
BOTTOM TIER •Average population under the poverty line: 28% •Bhutan, Pakistan, & Vietnam: 12%, 12.4% & 17.2% •Timor-Leste, Tajikistan, & Afghanistan: 49.9%, 47.2%, % 35.8%
BOTTOM TIER •Average rural population with water access: 75.6% •Bhutan, Vietnam, & India: 97%, 94%, and 91% •Yemen, Afghanistan, Timor-Leste: 47%, 56%, 61% •Bangladesh: 84%
BOTTOM TIER •Average Water Access to Urban Population: 91.5% •Bhutan, Vietnam and Kyrgyzstan: near 100% •Yemen, Bangladesh, Afghanistan: 72%, 85%, 89% •All countries are faring well
BOTTOM TIER •Average Urban Access to Sanitation: 75% •Afghanistan, Bangladesh, Nepal: 46%, 55%, 51% •Tajikistan, Vietnam, Yemen: 93%, 93%, 92%
BOTTOM TIER •Average ratio of female to male in Primary Enrollment: 95% •All countries are above or near Tier Average •Except Afghanistan and Yemen with 71%and 82%
BOTTOM TIER •Average ratio of female to male in secondary enrollment: 90% •Pakistan, Laos, Yemen, Afghanistan are far behind with 73%, 87%, 65%, and 55%respectively. •Bangladesh has the highest enrollment at 113% in the first tier
BOTTOM TIER •Average ratio Female to Male in tertiary enrollment: 76.9% •Exceptional performance: Kyrgyzstan, Myanmar, and Vietnam with 124%, 134%, and 101% respectively. •Afghanistan and Yemen are still falling behind
BOTTOM TIER •Average Life Expectancy in the Tier is 67years •Afghanistan and Yemen behind with 61and 63years •Bangladesh above average: 70years
MIDDLE TIER •Average population under the poverty line: 17.7% •Syria and Armenia having the highest with 35.2%and 32.4%
MIDDLE TIER •Average water access to rural population: 84.6% •Turkmenistan, Mongolia, and Azerbaijan with 54%, 61%, and 71% are falling behind
MIDDLE TIER •Average Urban population with water access: 95.4% •Except for Turkmenistan with 89%all the countries are near the average