Download
1 / 31
320 likes | 409 Vues
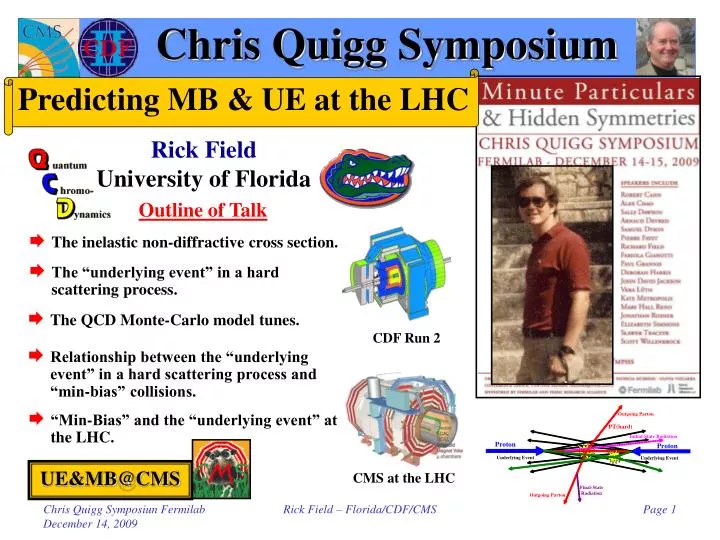
Chris Quigg Symposium. Predicting MB & UE at the LHC. Rick Field University of Florida. Outline of Talk. The inelastic non-diffractive cross section. The “underlying event” in a hard scattering process. The QCD Monte-Carlo model tunes. CDF Run 2.

E N D
Chris Quigg Symposium Predicting MB & UE at the LHC Rick Field University of Florida Outline of Talk • The inelastic non-diffractive cross section. • The “underlying event” in a hard scattering process. • The QCD Monte-Carlo model tunes. CDF Run 2 • Relationship between the “underlying event” in a hard scattering process and “min-bias” collisions. • “Min-Bias” and the “underlying event” at the LHC. UE&MB@CMS CMS at the LHC Rick Field – Florida/CDF/CMS
J.D.J. Students “Older than Dirt” hat! Chris Quigg Bob Cahn me Gordy Kane J.D.J J.D.J Jimmie & Rick Rick Field – Florida/CDF/CMS
Proton-Proton Collisions stot = sEL + sSD+sDD+sHC ND “Inelastic Non-Diffractive Component” The “hard core” component contains both “hard” and “soft” collisions. Rick Field – Florida/CDF/CMS
Inelastic Non-Diffractive Cross-Section • The inelastic non-diffractive cross section versus center-of-mass energy from PYTHIA (×1.2). My guess! Linear scale! Log scale! stot = sEL + sSD+sDD+sND • sHC varies slowly. Only a 13% increase between 7 TeV (≈ 58 mb) and 14 teV (≈ 66 mb). Linear on a log scale! Rick Field – Florida/CDF/CMS
“Hard Scattering” Component QCD Monte-Carlo Models:High Transverse Momentum Jets • Start with the perturbative 2-to-2 (or sometimes 2-to-3) parton-parton scattering and add initial and final-state gluon radiation (in the leading log approximation or modified leading log approximation). “Underlying Event” • The “underlying event” consists of the “beam-beam remnants” and from particles arising from soft or semi-soft multiple parton interactions (MPI). The “underlying event” is an unavoidable background to most collider observables and having good understand of it leads to more precise collider measurements! • Of course the outgoing colored partons fragment into hadron “jet” and inevitably “underlying event” observables receive contributions from initial and final-state radiation. Rick Field – Florida/CDF/CMS
Proton Proton Proton Proton MPI, Pile-Up, and Overlap MPI: Multiple Parton Interactions • MPI: Additional 2-to-2 parton-parton scatterings within a single hadron-hadron collision. Pile-Up Interaction Region Dz • Pile-Up: More than one hadron-hadron collision in the beam crossing. Overlap • Overlap: An experimental timing issue where a hadron-hadron collision from the next beam crossing gets included in the hadron-hadron collision from the current beam crossing because the next crossing happened before the event could be read out. Rick Field – Florida/CDF/CMS
CDF Run 1: Evolution of Charged Jets“Underlying Event” • Look at charged particle correlations in the azimuthal angle Df relative to the leading charged particle jet. • Define |Df| < 60o as “Toward”, 60o < |Df| < 120o as “Transverse”, and |Df| > 120o as “Away”. • All three regions have the same size in h-f space, DhxDf = 2x120o = 4p/3. Charged Particle Df Correlations PT > 0.5 GeV/c |h| < 1 Look at the charged particle density in the “transverse” region! “Transverse” region very sensitive to the “underlying event”! CDF Run 1 Analysis Rick Field – Florida/CDF/CMS
PYTHIA 6.206 Defaults MPI constant probability scattering • Plot shows the “Transverse” charged particle density versus PT(chgjet#1) compared to the QCD hard scattering predictions of PYTHIA 6.206 (PT(hard) > 0) using the default parameters for multiple parton interactions and CTEQ3L, CTEQ4L, and CTEQ5L. PYTHIA default parameters Default parameters give very poor description of the “underlying event”! Note Change PARP(67) = 4.0 (< 6.138) PARP(67) = 1.0 (> 6.138) Rick Field – Florida/CDF/CMS
Tuning PYTHIA:Multiple Parton Interaction Parameters Hard Core Determines the energy dependence of the MPI! Determine by comparing with 630 GeV data! Affects the amount of initial-state radiation! Take E0 = 1.8 TeV Reference point at 1.8 TeV Rick Field – Florida/CDF/CMS
Run 1 PYTHIA Tune A CDF Default! • Plot shows the “transverse” charged particle density versus PT(chgjet#1) compared to the QCD hard scattering predictions of two tuned versions of PYTHIA 6.206 (CTEQ5L, Set B (PARP(67)=1)andSet A(PARP(67)=4)). PYTHIA 6.206 CTEQ5L Run 1 Analysis Old PYTHIA default (more initial-state radiation) Old PYTHIA default (more initial-state radiation) New PYTHIA default (less initial-state radiation) New PYTHIA default (less initial-state radiation) Rick Field – Florida/CDF/CMS
CDF Run 1 Min-Bias “Associated”Charged Particle Density “Associated” densities do not include PTmax! Highest pT charged particle! • Use the maximum pT charged particle in the event, PTmax, to define a direction and look at the the “associated” density, dNchg/dhdf, in “min-bias” collisions (pT > 0.5 GeV/c, |h| < 1). It is more probable to find a particle accompanying PTmax than it is to find a particle in the central region! • Shows the data on the Df dependence of the “associated” charged particle density, dNchg/dhdf, for charged particles (pT > 0.5 GeV/c, |h| < 1, not including PTmax) relative to PTmax (rotated to 180o) for “min-bias” events. Also shown is the average charged particle density, dNchg/dhdf, for “min-bias” events. Rick Field – Florida/CDF/CMS
CDF Run 1 Min-Bias “Associated”Charged Particle Density Rapid rise in the particle density in the “transverse” region as PTmax increases! PTmax > 2.0 GeV/c Transverse Region Transverse Region Ave Min-Bias 0.25 per unit h-f PTmax > 0.5 GeV/c • Shows the data on the Df dependence of the “associated” charged particle density, dNchg/dhdf, for charged particles (pT > 0.5 GeV/c, |h| < 1, not including PTmax) relative to PTmax (rotated to 180o) for “min-bias” eventswith PTmax > 0.5, 1.0, and 2.0 GeV/c. • Shows “jet structure” in “min-bias” collisions (i.e.the “birth” of the leading two jets!). Rick Field – Florida/CDF/CMS
Min-Bias “Associated”Charged Particle Density • Shows the “associated” charged particle density in the “toward”, “away” and “transverse” regions as a function of PTmax for charged particles (pT > 0.5 GeV/c, |h| < 1, not including PTmax) for “min-bias” events at 1.96 TeVfrom PYTHIA Tune A (generator level). “Toward” Region ~ factor of 2! “Transverse” “Transverse” • Shows the Df dependence of the “associated” charged particle density, dNchg/dhdf, for charged particles (pT > 0.5 GeV/c, |h| < 1, not including PTmax) relative to PTmax (rotated to 180o) for “min-bias” events at 1.96 TeVwith PTmax > 0.5, 1.0, 2.0, 5.0, and 10.0 GeV/c from PYTHIA Tune A (generator level). Rick Field – Florida/CDF/CMS
Charged Particle Multiplicity New • Data at 1.96 TeV on the charged particle multiplicity (pT > 0.4 GeV/c, |h| < 1) for “min-bias” collisions at CDF Run 2. Tune A! No MPI! 7 decades! • The data are compared with PYTHIA Tune A and Tune A without multiple parton interactions (pyAnoMPI). Rick Field – Florida/CDF/CMS
The “Underlying Event” Select inelastic non-diffractive events that contain a hard scattering Hard parton-parton collisions is hard (pT > ≈2 GeV/c) “Semi-hard” parton-parton collision (pT < ≈2 GeV/c) The “underlying-event” (UE)! + + + … Given that you have one hard scattering it is more probable to have MPI! Hence, the UE has more activity than “min-bias”. Multiple-parton interactions (MPI)! Rick Field – Florida/CDF/CMS
The Inelastic Non-Diffractive Cross-Section Occasionally one of the parton-parton collisions is hard (pT > ≈2 GeV/c) Majority of “min-bias” events! “Semi-hard” parton-parton collision (pT < ≈2 GeV/c) + + + + … Multiple-parton interactions (MPI)! Rick Field – Florida/CDF/CMS
The “Underlying Event” Select inelastic non-diffractive events that contain a hard scattering Hard parton-parton collisions is hard (pT > ≈2 GeV/c) “Semi-hard” parton-parton collision (pT < ≈2 GeV/c) The “underlying-event” (UE)! + + + … Given that you have one hard scattering it is more probable to have MPI! Hence, the UE has more activity than “min-bias”. Multiple-parton interactions (MPI)! Rick Field – Florida/CDF/CMS
Min-Bias Correlations New • Data at 1.96 TeV on the average pT of charged particles versus the number of charged particles (pT > 0.4 GeV/c, |h| < 1) for “min-bias” collisions at CDF Run 2. The data are corrected to the particle level and are compared with PYTHIA Tune A at the particle level (i.e. generator level). Rick Field – Florida/CDF/CMS
Min-Bias: Average PT versus Nchg • Beam-beam remnants (i.e. soft hard core) produces low multiplicity and small <pT> with <pT> independent of the multiplicity. • Hard scattering (with no MPI) produces large multiplicity and large <pT>. • Hard scattering (with MPI) produces large multiplicity and medium <pT>. This observable is sensitive to the MPI tuning! = + + The CDF “min-bias” trigger picks up most of the “hard core” component! Rick Field – Florida/CDF/CMS
Charged Particle Multiplicity • Data at 1.96 TeV on the charged particle multiplicity (pT > 0.4 GeV/c, |h| < 1) for “min-bias” collisions at CDF Run 2. Tune A prediction at 900 GeV! No MPI! Tune A! • The data are compared with PYTHIA Tune A and Tune A without multiple parton interactions (pyAnoMPI). • Prediction from PYTHIA Tune A for proton-proton collisions at 900 GeV. Rick Field – Florida/CDF/CMS
Peter’s Pythia Tunes WEBsite • http://home.fnal.gov/~skands/leshouches-plots/ Rick Field – Florida/CDF/CMS
Min-Bias “Associated”Charged Particle Density 35% more at RHIC means 26% less at the LHC! • Shows the “associated” charged particle density in the “transverse” regions as a function of PTmax for charged particles (pT > 0.5 GeV/c, |h| < 1, not including PTmax) for “min-bias” events at 0.2 TeV and 14 TeVfrom PYTHIA Tune DW and Tune DWT at the particle level (i.e. generator level). The STAR data from RHIC favors Tune DW! ~1.35 ~1.35 0.2 TeV → 14 TeV (~factor of 70 increase) RHIC LHC Rick Field – Florida/CDF/CMS
Min-Bias “Associated”Charged Particle Density • Shows the “associated” charged particle density in the “transverse” region as a function of PTmax for charged particles (pT > 0.5 GeV/c, |h| < 1, not including PTmax) for “min-bias” events at 0.2 TeV, 1.96 TeV and 14 TeVpredicted by PYTHIA Tune DW at the particle level (i.e. generator level). ~1.9 ~2.7 0.2 TeV → 1.96 TeV (UE increase ~2.7 times) 1.96 TeV → 14 TeV (UE increase ~1.9 times) RHIC LHC Tevatron Rick Field – Florida/CDF/CMS
The “Underlying Event” at STAR • At STAR they have measured the “underlying event at W = 200 GeV (|h| < 1, pT > 0.2 GeV) and compared their uncorrected data with PYTHIA Tune A + STAR-SIM. Rick Field – Florida/CDF/CMS
LHC Predictions: 900 GeV DD/NSD = 12±4% (SD + DD)/INEL = 28±8% • Compares the 900 GeV data with my favorite PYTHIA Tunes (Tune DW and Tune S320 Perugia 0). Tune DW uses the old Q2-ordered parton shower and the old MPI model. Tune S320 uses the new pT-ordered parton shower and the new MPI model. The numbers in parentheses are the average value of dN/dh for the region |h| < 0.6. Rick Field – Florida/CDF/CMS
LHC Predictions: 900 GeV Off by 11%! Require at least one charged particle to have pT > 1 GeV/c. This is > 99% HC only! (SD + DD)/INEL = 28±8% • Shows the individual HC, DD, and SD predictions of PYTHIA Tune DW and Tune S320 Perugia 0. The numbers in parentheses are the average value of dN/dh for the region |h| < 0.6. I do not trust PYTHIA to model correctly the DD and SD contributions! I would like to know how well these tunes model the HC component. We need to look at observables where only HC contributes! Rick Field – Florida/CDF/CMS
Min-Bias “Associated”Charged Particle Density • Shows the “associated” charged particle density in the “transverse” region as a function of PTmax for charged particles (pT > 0.5 GeV/c, |h| < 1, not including PTmax) for “min-bias” events at 0.2 TeV, 0.9 TeV, 1.96 TeV, 7 TeV, 10 TeV, 14 TeVpredicted by PYTHIA Tune DW at the particle level (i.e. generator level). LHC14 LHC10 LHC7 Tevatron 900 GeV RHIC 0.2 TeV → 1.96 TeV (UE increase ~2.7 times) 1.96 TeV → 14 TeV (UE increase ~1.9 times) RHIC LHC Tevatron Linear scale! Rick Field – Florida/CDF/CMS
Min-Bias “Associated”Charged Particle Density • Shows the “associated” charged particle density in the “transverse” region as a function of PTmax for charged particles (pT > 0.5 GeV/c, |h| < 1, not including PTmax) for “min-bias” events at 0.2 TeV, 0.9 TeV, 1.96 TeV, 7 TeV, 10 TeV, 14 TeVpredicted by PYTHIA Tune DW at the particle level (i.e. generator level). LHC14 LHC10 LHC7 Tevatron 900 GeV RHIC 7 TeV → 14 TeV (UE increase ~20%) LHC7 LHC14 Linear on a log plot! Log scale! Rick Field – Florida/CDF/CMS
“Transverse” Charge Density factor of 2! 900 GeV → 7 TeV (UE increase ~ factor of 2.1) LHC 900 GeV LHC 7 TeV • Shows the charged particle density in the “transverse” region for charged particles (pT > 0.5 GeV/c, |h| < 2) at 900 GeVas defined by PTmax from PYTHIATune DW and Tune S320 at the particle level (i.e. generator level). Rick Field – Florida/CDF/CMS
Important 900 GeV Measurements It is very important to measure BOTH “min-bias” and the and the “underlying event” at 900 GeV! To do this we need to collect about 5,000,000 CMS min-bias triggers! • The amount of activity in “min-bias” collisions (multiplicity distribution, pT distribution, PTsum distribution, dNchg/dh). For every 1,000 events here We get 3 events here! • The amount of activity in the “underlying event” in hard scattering events (“transverse” Nchg distribution, “transverse” pT distribution, “transverse” PTsum distribution for events with PTmax > 5 GeV/c). • We should map out the energy dependence of the “underlying event” in a hard scattering process from 900 GeV to 14 TeV! Rick Field – Florida/CDF/CMS
The “Underlying Event” at 900 GeV • Show how well we could measure the “transverse” charged particle density versus PTmax with 10 M, 1 M, and 0.5 M “min-bias” (MB) events collected by CMS. Assumes that for all the events that the tracker is working well! The goal is to see how well the data (red squares) agree with the QCD MC prediction (black curve). Unfortunately, looks like this is all we will get! Rick Field – Florida/CDF/CMS