Download
1 / 15
150 likes | 312 Vues
Ozone and stratosphere in MERRA validation runs. October 11, 2007. Ozone Profiles, July 2004, 30 -60 N GEOS-5/SBUV v. SAGE II, POAM & sonde. POAM. SAGE II. WOUDC ozone sondes. A typical example of validation in middle latitudes. Run d5_b10p15_jan04 using NOAA-16

E N D
Ozone and stratospherein MERRA validation runs October 11, 2007
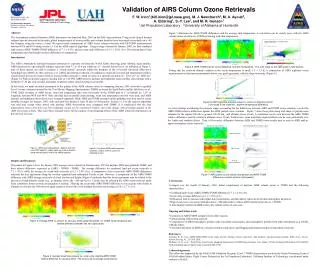
Ozone Profiles, July 2004, 30-60NGEOS-5/SBUV v. SAGE II, POAM & sonde POAM SAGE II WOUDC ozone sondes A typical example of validation in middle latitudes Run d5_b10p15_jan04 using NOAA-16 SBUV/2 ozone data - Ozone agrees well with validation data in NH summer - There is a slight overestimate of peak values (near 15hPa).
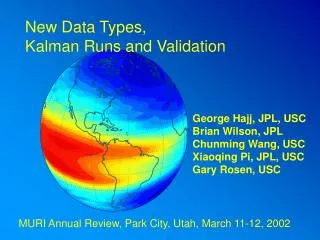
60ºS-30ºS 30ºS-30ºN 30ºN-60ºN Ozone Profiles, July 1987GEOS-5/SBUV versus SAGE-II • Good agreement of mean ozone profiles against SAGE II in the stratosphere. • There is a high bias in the mesosphere, but this is a sampling problem: SAGE-II is occultation - some of validated data are in the night, SAGE always in the day Run d5_b10p16_jul87
Mesospheric Ozone - Bias or Sampling? 60°S-30°S 30°S-30°N 30°N-60°N • Restricting the comparison to profiles that are sunlit in the analysis removes the bias. • Cosine of the solar zenith angle (cos z) should be saved at the analysis time to allow day/night conversion of ozone • Cos z currently saved does not match the analysis time, so the restriction was cos z > 0.06 Run d5_b10p16_jul87
Antarctic Ozone:Seasonal Bias compared to POAM February April June • High ozone bias develops near 80°S • In April 2004, strongest around 4hPa Run d5_b10p15_jan04
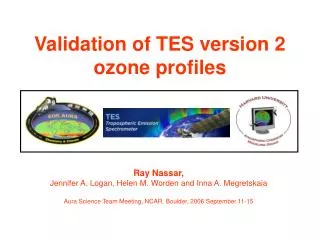
GEOS-5 snapshot GEOS-4/Aura snapshot Total Ozone, 00Z 15 January 2006GEOS-5/SBUV & GEOS-4/Aura Run d5_b10p15_jan06 Stajner et al. (2007) Dominant features in the GEOS-5/SBUV analyses are comparable to those in the GEOS analysis containing OMI and MLS data
Quasi Biennial Oscillation Observed monthly mean zonal wind at Singapore M. Giorgetta, Max Planck Institute for Meteorology, following Naujokat (1986) • Monthly mean zonal wind at Singapore from the run d5_b10p15_jan04 shows good agreement with the observations. • Some differences seen in July between 10 and 30 hPa. Run d5_b10p15_jan04
QBO impact on ozone Zonal wind (color) and ozone (contour) • In the lowermost stratosphere ozone varies as expected • Ozone gradient near the zero-wind line is underestimated (e.g. near 30 hPa in January) Run d5_b10p15_jan04 From Logan et al. (2003)
Residual circulation in January 2004 Run d5_b10p15_jan04
Temperature comparison against Lidar data • Mean differences of up to 10K are seen in the upper stratosphere Table Mountain Lidar Run d5_b10p15_jan04
Summary • GEOS-5 ozone compares well with: • GEOS-4-based Aura (OMI+MLS) assimilation in Jan. 2006 • SAGE II, HALOE, POAM, sondes in Jan. 1987, Jan.-Oct. 2004 • Cosine of the solar zenith angle should be saved at the analysis time (for correct interpretation of mesospheric ozone) • Seasonal bias in comparisons with POAM at southern high latitudes • QBO: wind transition appears well captured, ozone variability in the lower stratosphere seems realistic, but vertical gradients near the zero-wind line are underestimated • Reasonable large scale features in the residual circulation • Temperature compared with Lidars: up to 10K differences in the upper stratosphere
Ozone at Nairobi in January 2004 • Ozone gradient between 30 and 40 hPa is weaker in GEOS-5 than in the sondes Pressure (hPa) Run d5_b10p15_jan04
Zonal-Mean Ozone for January 2006 GEOS-5 GEOS-4 Aura • Features are similar • GEOS-5 ozone is higher near 10 hPa in the Topics, around 20 hPa near 90°N, around 30 hPa near 90°S Stajner et al. (2007) Run d5_b10p15_jan06
Mean ozone profile, 60N-90N 00Z 15 January 2006 • GEOS-5 mostly unconstrained by ozone data (no SBUV in the polar night). • 1-30 hPa: more ozone in GEOS-5 • 30-200 hPa: more ozone in GEOS-4 Aura assimilation. This is consistent with the larger total ozone in GEOS-4 in the polar night. Pressure (hPa) d5_b10p15_jan06 GEOS-4 Aura ozone assimilation
Ozone Profiles, Jan. 2006, 30-60NGEOS-5/SBUV [Version 6] v. sonde Analysis bias is consistent with that identified earlier in the assimilation of SBUV Version 6 data in GEOS-4 (Wargan et al 2005). MERRA will use Version 8 SBUV data. UL 5 UL 4 UL 3 Pressure (hPa) Run d5_b10p15_jan06