Download
1 / 9
90 likes | 241 Vues
Summary from Previous Lecture. Real networks: AS-level N= 12709, M=27384 (Jan 02 data) route-views.oregon-ix.net, hhtp://abroude.ripe.net/ris/rawdata router-level Traceroute servers, www.traceroute.org www graph N=O(billions) (1999 data)

E N D
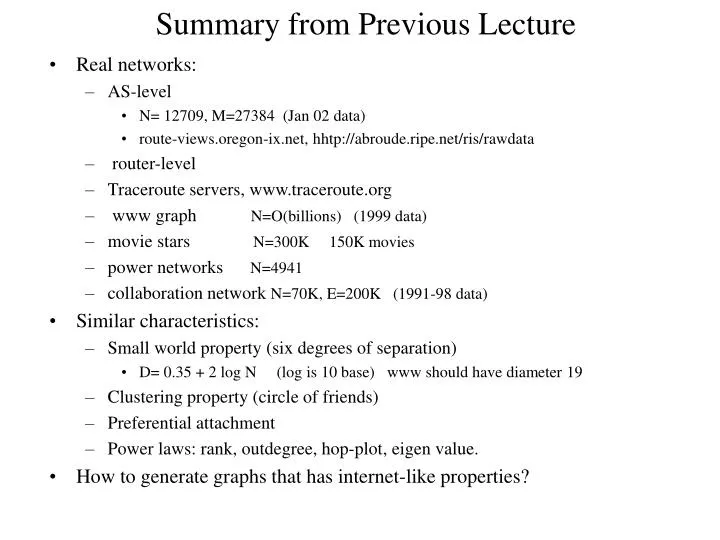
Summary from Previous Lecture • Real networks: • AS-level • N= 12709, M=27384 (Jan 02 data) • route-views.oregon-ix.net, hhtp://abroude.ripe.net/ris/rawdata • router-level • Traceroute servers, www.traceroute.org • www graph N=O(billions) (1999 data) • movie stars N=300K 150K movies • power networks N=4941 • collaboration network N=70K, E=200K (1991-98 data) • Similar characteristics: • Small world property (six degrees of separation) • D= 0.35 + 2 log N (log is 10 base) www should have diameter 19 • Clustering property (circle of friends) • Preferential attachment • Power laws: rank, outdegree, hop-plot, eigen value. • How to generate graphs that has internet-like properties?
Global Metrics (Graph) • Min, max and Average node degree • Diameter • Hop-plot value, hop-plot exponent • Effective diameter • Frequency of node degrees • Characteristic path length • Clustering coefficient • Size of the giant component • Eigenvalue exponent • Expansion • Resilience • Distortion
Local Metrics (Node) • Degree • Rank • Clustering coefficient • Eccentricity • Significance • Betweenness • Closeness
Internet Topology Generators • Motivation: performance of network protocols/algorithms may vary depending on the methods. • Flat Random Methods: • Place the nodes on a plane randomly • [ER]: p, n • [Waxman88]: P(u,v)= exp (-d/( L) ) >0 <= 1 • Exponential: P(u,v)= exp (-d/( L-d) ) • Locality: P(u,v) = if d < r; o.w. [Gatech97] • Hierarchical Methods • N-level: • Place nodes on Euclidean Plane randomly • Divide the plane into equal size square sectors (scale parameter S1 for level 1) • Assign each node to a square out of S1xS1 squares • Subdivide each square with a node using S2 • Edge lengths are determined by the level
Hierarchical Methods Cont. Stub domain: u,v are in the same domain Gateway router Backbone router Transit domain: u,v are in different domains Parameters: T, Nt, K, Ns
Incremental Models • Watts and Strogatz [WS98] • Start with a ring lattice of n nodes and k edges per node. • Rewiring process with probability p (p=0 regular, p=1 random) • Barabasi and Albert [BA99] • Start with a small network core • At each step choose randomly between • Adding a new node with m link • Adding m links without a new node • Linear preferential attachment • F(d) power law exponents are much less than the measured ones -(2.18 vs –3) • Albert and Barabasi [AB00] • Consider rewiring of m links with linear preferential attachment • Not always a connected graph.
BRITEhttp://www.cs.bu.edu/fac/matta/software.html • Node assignment: • High level square (HS), Low level squares (LS); HSxHS, LSxLS • Choose a LS and drop a node in there • For each HS pick a number “n” of nodes randomly from the following distribution (I.e., bounded Pareto dist.) --1 F(n)= (k n ) / 1-(k/P) P=LSxLSxD, k>=1 • Link assignment: parameter ‘m” #of links per new node • New node v is connected to i with • P(v,i)= wi di/ wj dj j Cv where Cv is the set of candidate nodes for v • di is the degree of node i
INEThttp://topology.eece.umich.edu/inet • Number of nodes N and the fraction k of N that has outdegree of 1 • Assumes exponential growth rate and computes number of months (t) it would take the internet to grow from its size in Nov 1997 to N. • Compute outdegree-frequency and rank-outdegree distributions • Construct the network in three steps • Form a spanning tree of nodes with degree at least 2 • Attach nides with degree 1 to the tree • Connect all the remaining nodes to satisfy their degree properties • With probability k/K K= sum of outdegrees of all nodes already in G
References • [Waxman88]:B. M. Waxman, “Routing of multipoint connections,” IEEE JSAC, 6(9):1617-1622. • [Gatech97]: E. Zagura et al, “A quantitative Comparision of Graph-Based Model for Internet Topology”, ACM/IEEE ToN 5(6):770-783, Dec. 1997. • [FFF99] M. Faloutsos et al, “On power-Law relationships of the Internet Topology”. ACM SIGCOMM’99, August 1999. • [BA99]:A. Barabasi, R. Albert, “Emerging of scaling in random networs,” Science, 509-512, October 1999. • [WS98]: D.J.Watts and S.H. Strogatz, “Collective Dynamics of small-world” networks,” Nature 393,440-442, 1998. • [AB00]:R. Albert, A. Barabasi, “Topology of evolving Network: local events and Universality”, Phys. Rew. Letters 85:5234-5237, 2000.