Download
1 / 24
240 likes | 710 Vues
Simplifying SQL Server Performance Tuning. Greg Linwood MyDBA gregl@mydba.com. About Me. Director of MyDBA / SQLskills Microsoft SQL Server MVP since 2003 Founding member of Australian SQL Server User Group. Agenda. Treat the cause, not the symptoms! Understanding query processing basics

E N D
Simplifying SQL Server Performance Tuning Greg Linwood MyDBA gregl@mydba.com
About Me • Director of MyDBA / SQLskills • Microsoft SQL Server MVP since 2003 • Founding member of Australian SQL Server User Group
Agenda • Treat the cause, not the symptoms! • Understanding query processing basics • Identifying Query Bottlenecks • Identifying Infrastructure Bottlenecks • Special case – tempdb • Solid State Drives
Treat the cause, not the symptoms! • Performance tuning rules: a) everything relates to queries b) tune the source (queries), not the symptoms (hardware) • 90% of perf tuning is in identifying root causes • Once causes identified, resolution is generally relatively easy
Treat the cause, not the symptoms! (cont..) • Don’t lose time measuring the consequences, get straight down to business with the queries (the source). • First, identify inefficient queries • Use tools designed to monitor queries: • SQL Profiler / SQL Trace • DMVs & system queries • Then, tune queries identified • Are queries properly indexed • (not only SELECTs – Upd, Del & Ins too) • Are queries poorly written • Inappropriate use of UDFs, Cursors etc
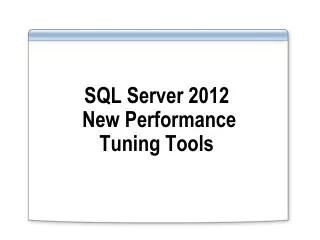
SQL Server stores table rows & columns (Authors Table in pubs db has ~26rows and is approx 6kb total size) Physical Memory (RAM) Table rows are stored on Disk in 8kb units, named “pages”. When loaded into memory pages are referred to as “buffers” Data volume (HDD) Write ahead log (TLOG) Buffer Manager SQL Server Query Processing basics Pages read from disk - slow Pages read from cache – tres fast! Yes? Execute.. No? Compile & Execute.. All DB changes hardened in TLog Then, DB changes written to cache Pages can by dirtied multiple times Execution Plan Found? Dirty pages later flushed to .mdf Select * from authors where au_lname = ‘White’ update authors set au_fname = ‘Johnston’ where au_lname = ‘White’ au_id au_lname au_fname phone address city state 172-32-1176 White Johnson 408-496-7223 10932 Bigge Rd. Oakland CA Lookup Pages In Data Cache update authors set au_fname = ‘Marj’ where au_lname = ‘Green’ Lookup Exec Plan in Proc Cache UPDATE Data Cache Proc Cache MTL 256Mb UPDATE
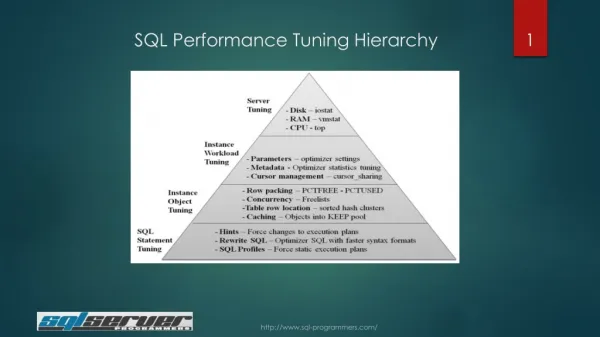
1 3 Query Processing Example - Nested Loops Join An index seek (3 page reads) is performed against SalesOrderDetail FOR EACH row found in the seek range. If a large number of rows are involved in execution plan node (not just results) this can be very costly select p.Class, sod.ProductID from Production.Product p join Sales.SalesOrderDetail sod on p.ProductID = sod.ProductID where p.Class = ‘M‘ and sod.SpecialOfferID = 2
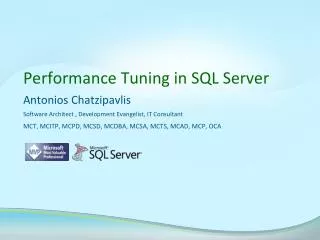
1 Query Processing Example - Merge Join Values on either side of ranges being merged compared for (in)equality select p.Class, sod.ProductID from Production.Product p join Sales.SalesOrderDetail sod on p.ProductID = sod.ProductID where p.Class = ‘M‘ and sod.SpecialOfferID = 2
Identifying Query Bottlenecks • SQL Server Profiler • Collect RPC:SPCompleted / TSQL:BatchCompleted events • Filter with Reads > 10,000 at first, reduce to 1,000 • # of reads = # of pages “read” from cache (disk if not cached) • CPU, Duration, Writes & RowCount also interesting, but reads is the best representation of source workload • Relies on queries completing • On a swamped server, queries might be piling up without completing, therefore not showing up in Profiler as completed events as fast as they are starting. • SQL Trace • Same as Profiler, but runs in background • Far lower performance impact that Profiler GUI • Requires post analysis of .trc log files collected • 3rd Party Tools – SQLBenchmarkPro (continuous) / Cleartrace (ad-hoc) • Can be scripted from GUI Profiler
Identifying Query Bottlenecks (cont..) • DMVs • Gives only a current snapshot of query / procedure cache • All data lost between restarts • Similar to SQL Trace \ Profiler in that updates only occur POST query completion. Therefore not quite up to the second information. • Important DMVs: • sys.dm_exec_query_stats – reads / time by sql_handle • sys.dm_exec_query_plan() – execution plan by sql_handle • sys.dm_exec_sql_text() – query text by sql_handle • Identify slow queries by joining above three DMVs together
Identifying Query Bottlenecks (cont..) • What about up to the second perf info? • sys.sysprocesses (sysprocesses in SQL2K) • provides up to the second data on CPU, IO PRIOR to query completion • can be joined to DMVs via sql_handle to obtain executing query data • SQL2k options • DBCC INPUTBUFFER() • fn_getsql() • sys.dm_os_workers DMV provides further info from thread perspective
What about query blocking? • Use Profiler / SQL Trace – “Blocked Process Report” Event • Must configure “Blocked Process Threshold” • configuration set in seconds (# of seconds blocked) • trace events continually raised every x seconds
What about query blocking? (cont..) • Blocked queries are usually caused by inefficient queries taking more locks than necessary • Blocked queries are usually a consequence of other poorly performing queries • Still worth monitoring with Blocked Process Report trace to identify (other) inefficient queries for tuning • Snapshot isolation level provides an alternative to readers being blocked by writers • readers see previous committed value and read past rather than be blocked by writers.
System Capacity Requirements Server Capacity Query Workload Query Workload Server Capacity Server Capacity Query Workload Inefficient Query Workload (large) Insufficient Server Capacity (small) Efficient Query Workload (small) Excess Server Capacity (large) Efficient Query Workload (small) Sufficient Server Capacity (small) • You can deal with capacity issues by tuning query workload, or increasing hardware, but tuning workload is most effective & cheaper
Infrastructure bottlenecks • Workload vs Memory New features released • Logical Page Reads / sec shows TOTAL number of query reads / sec. • Increases represent either: • New features, possibly not well tuned (this case) • Query optimisation problems • Increased utilisation
Infrastructure bottlenecks • Workload vs Memory (cont..) • Buffer Life Expectancy shows average time (secs) page buffers survive in data cache before being forced out by pressure from other queries • High Number (> 1000 secs for OLTPs) is good (low cache cycling) • Decreases represent either: • Inefficient query workload (new changes / optimisation issues) • Increased utilisation
Infrastructure bottlenecks • Workload vs Memory (cont..) • Memory is the most significant infrastructure component to size correctly • Unless utlisation genuinely increases significantly or memory is actually reduced, memory problems are typically consequences of other problems. • If query workload efficiency has degraded (increased reads), usually better to tune queries (source of problem) than simply add more memory. • Requires problem query identification (Profiler, Trace, DMVs) • Might not be “tunable” (eg vendor applications)
Special case - tempdb • Weird things happen in tempdb • Large resultset query sorting (ORDER BY) on disk • Turns SELECT queries from pure disk reads (in user db), to read + write + read • Temp Tables AND Table Variables are created on disk • Table “variables” are actually on-disk structures • Even worse, fully logged – so TWO disk writes for every operation • Cursors are materialised in tempdb • Static cursors – full resultsetmaterialised in temp tables in tempdb • Keyset cursors – just keysets are materialised in temp tables in tempdb • Version store is materialised in tempdb • Under snapshot isolation, db updates are written to disk in tempdb, allowing other queries to read previously committed results
Special case - tempdb • tempdb’s workload is random & IO intensive in nature • all cases listed above occur on a per-session basis, so many users can be causing each of the disk IO workloads concurrently • all cases listed above are highly disk WRITE oriented in nature • temp table & cursor population, resultset sorting & versioning all WRITE to disk • often causes significantly higher random, concurrent disk activity than user databases • hard drive disk heads can only be physically in one place at any point in time • tempdb‘s random, concurrent, highly write intensive disk activity can generate enormous queued disk workloads
Solid State Drives (SSDs) • SSDs are similar in nature to RAM. • No physically moving parts • Concurrent access • Extremely high speed • SSDs are similar in nature to RAM. • No physically moving parts • Concurrent access • Extremely high speed • SSDs are ideal for tempdb, given tembdb’s disk oriented workload • SSDs have lower mean time between failures than HDDs • no moving parts to wear down • HDDs involve physically moving metal at high speed
Solid State Drives (SSDs) • Even if SSD fails, having tempdb on it creates no risk • tempdb persists no transactional data • tempdb is totally rebuilt upon every reboot of SQL Server • even if device totally fails, tempdb can be relocated on HDD during restart of SQL Server • Testing / Live results • Customer testing & live deployment of SDD on tempdb alone confirms significant improvement in system performance • large-scale financial services online system • 19,000% reduction in IO stalls in batch processing
Solid State Drives (SSDs) • SSDs are affordable – single drives ~$5>7k (AU) • SSD we’ve tested / deployed is FusionIO • Distributed in Australia by IOMax – www.IOMax.com.au
Reference material • Books with excellent performance tuning content • “SQL Server Query Performance Tuning Distilled”, Sajal Dam • http://www.apress.com/book/bookDisplay.html?bID=371 • “SQL Server 2005 Performance Tuning”, various • http://www.wrox.com • “Guru’s Guide to SQL Server Architecture & Internals”, Ken Henderson • http://www.amazon.com/exec/obidos/tg/detail/-/0201700476/ref=pd_bxgy_img_2/104-7280867-1941549?v=glance&s=books • “SQL Server 2005 Practical Troubleshooting”, Ken Henderson • http://safari.oreilly.comamazon.com/0321447743
Thank you! • Questions?