Download
1 / 22
230 likes | 384 Vues
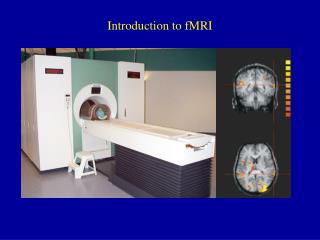
fMRI introduction. Michael Firbank m.j.firbank@ncl.ac.uk. Brain activation imaging. Functional imaging Used to locate regions of brain activity. Brain activation techniques. MRI. Magnetic resonance imaging (MRI) Person is placed in a large magnet

E N D
fMRI introduction Michael Firbank m.j.firbank@ncl.ac.uk
Brain activation imaging • Functional imaging • Used to locate regions of brain activity
MRI • Magnetic resonance imaging (MRI) • Person is placed in a large magnet • Approx 20 000 times earth’s magnetic field
MRI safety • Magnetic objects • Pacemakers • Metal implants
Water RF Energy In MR Signal Out Imaging Techniques ReminderMagnetic Resonance Imaging N S
1 0.8 0.6 Water 0.4 RF Energy MR Signal 0.2 0 Time TE Imaging Techniques ReminderMagnetic Resonance Imaging • Signal decays over a few 10s milliseconds • Rate depends on local tissue properties • T2 (*) N S
Neural activity • Brain uses ~20% of energy • Energy use linked to neuronal activity • Provided through glucose and oxygen • Oxygen is supplied by haemoglobin in blood • Oxy haemoglobin • Deoxy haemoglobin
High blood oxygenation Low blood oxygenation Linking MRI to brain function (fMRI) • MRI signal can be made sensitive to tissue oxygenation • Oxygenated haemoglobin is diamagnetic • No effect on image • “deoxy-haemoglobin” is paramagnetic • Locally alters magnetic field • Intrinsic contrast agent • Reduces signal amplitude Brain magnetic resonance imaging with contrast dependent on blood oxygenation Ogawa et al, Proc Nat AcadSci, 87:9868-9872, (1990).
Neural activity • Increased neuronal activity ► Increased oxygen consumption ► Increased blood flow in excess of oxygen demand ► Decreased deoxy-Haemoglobin concentration
Neural activity & BOLD • Deoxy Haemoglobin is paramagnetic • Causes local variations in magnetic field • Lower signal on T2* weighted images • Brain activation ► lower Deoxy Hb in capillaries/venules ► increased MR signal • Blood oxygenation level dependent signal (BOLD)
CBF/CBV takes over Oxygenates Initial “dip” (CMRO2 dominates) Deoxygenates fMRIBOLD andHaemodynamiceffects • Increased energy consumption extracts oxygen • Vasodilation and CBF increase oxygen supply • Hemodynamic response time of ~3s
BOLD response • Reasonably linearly additive Dale & Bucker 1997 HBM
BOLD response • Relative signal change • need to compare stimuli / mental tasks • Slow variations in baseline intensity • different tasks need to be close together • Signal change ~ 0.5 - 5 % • SNR ~ 0.5 - 2 • 5 minutes of acquisition (~200 MRI volumes)
“Dropout” Distortion fMR imaging • EPI sequence – fast and sensitive to T2* • Whole brain collection ~2s at ~3 mm resolution • Some distortion & signal dropout(particularly frontal) • Noisy (makes auditory tasks difficult)
fMRI acquisition Whole brain image collection every ~2 seconds whilst subject does some mental task “It is an ancient Mariner, ...” “London. Michaelmas term lately over...”
Sparse design Acquire image every 7-14 seconds Makes it easier to hear stimuli But inefficient Imaging BOLD response Stimulus Time (s)
Analysis • All scans spatially aligned together • Data spatially smoothed (~5mm) & Temporally filtered • Look for correlations between expected response function and data
Analysis Brain map showing regions with significant correlation between signal change and task
Analysis • For group studies, individual scans are transformed into a common coordinate space • Allows generalisations to be made about populations • Loses individual variations • Dependent on accuracy of transformation
rCBV/CBF ? Altered HbO2/Hb Ratio BOLD Effect Glucose O2 CMRO2 /CMRgl fMRI - SummaryFactors which modulateblood oxygenation Neuronal activity
fMRI summary • Sensitive to changes in blood oxygenation • Spatial resolution of ~2mm • Temporal resolution of seconds