Download
1 / 92
930 likes | 1.13k Vues
MarkeTrak V Hearing Aid Industry Market Tracking Survey. Sergei Kochkin, Ph.D. Knowles Electronics, Inc. June 1999. MarkeTrak Topics. Demographic indices & trends Customer satisfaction revisited Hearing aids in the drawer Subjective benefit. Demographic Indices.

E N D
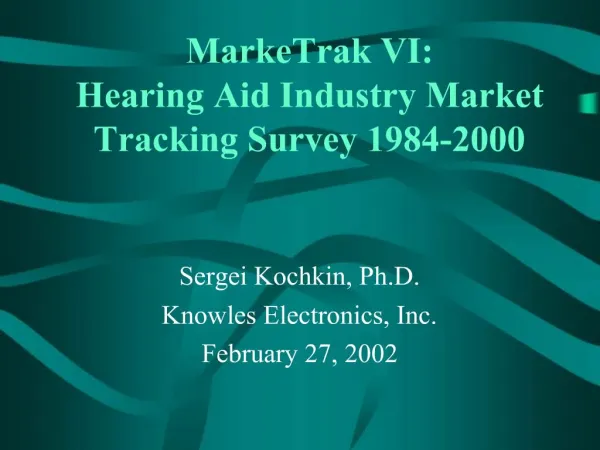
MarkeTrak VHearing Aid Industry Market Tracking Survey Sergei Kochkin, Ph.D. Knowles Electronics, Inc. June 1999
MarkeTrak Topics • Demographic indices & trends • Customer satisfaction revisited • Hearing aids in the drawer • Subjective benefit
Demographic Indices • National family opinion panel • 80,000 households • 13,492 hearing-impaired households • Detailed questionnaire 2,720 hearing aid owners. • Response rate 83% • No new survey to non-owners in MarkeTrak V.
Hearing Loss Population by Age GroupOwners versus Non-owners
Clinton Announcement Spurred “Baby Boomer” Potential Market Growth • Clinton news release 10/97. • Survey taken 11/97. • Age 45-54 hearing loss growth =23% • $60k growth =35% • Some college growth = 30%
Physician Screening for Hearing Loss During Physical Exam HIA Targeting with Physicians
Hearing Instrument Fittings by Source of Distribution (1997) Perhaps one to watch
Average Retail Price to Consumer +24% +11% +30% +12%
Age of Hearing Instrument Mean age of instruments: 1991 = 3.1 yrs 1994 = 3.7 yrs 1997 = 3.8 yrs
First Time User Rate Eddie Albert Ads FDA/FTC
Factors Influencing New First Time Users to Purchase • Factors less than 10% mentions: • Free HA (7%) • Price (6%) • Ad-magazine (5%) • HL Literature (3%) • Boss/co-worker (3%) • Newspaper (2%) • Direct mail (2%) • Ad - TV (1.5%)
Physician Recommendation Trends • 1989 - HIA advertising to physician. • Current initiatives: • Mfg. screening kit • BHI - physician handbook • BHI - Academy of Family Physicians • AAA Best Practice • Family doctor (Positive) • ENT (Negative)
Key Trends • Negative trends • hearing aid penetration • Static trends • hearing screenings by physicians • distribution penetration • Binaural penetration
Key Trends • Positive trends • third party payment • first time users • repeat purchase • retail price (??) • Clinton - motivation of “Baby Boomers” • 1 million new potential customers
Topics • Trends 1991-1997 (1-5 years old) • Segmentation (1-5 years old) • Publishing of new research norms (3-12 months old) • Hearing aids in the drawer (total)
Method • MarkeTrak Survey • 4 behavioral items (hours, repurchase) • 1 Quality of life • Likert Satisfaction Scale • 8 Product features • 12 Performance/value • 13 Listening situations • 6 dispenser attributes • Modified APHAB (21 point scale = 5%)
Amount of Time Spent CounselingNew Users of Hearing Instruments
Customer Satisfaction as a Function of Time Spent with New Users
Multiple Environmental Listening Utility (MELU) is Critical to Satisfying Consumers
Perceptions of Benefit as a Function of Multiple Environment Listening Utility (MELU)
Quantifiable Client Oriented Scale of Improvement (COSI) • MarkeTrak measures satisfaction in 13 listening situations (5 point scale). • Very Satisfied (+2) to very dissatisfied (-2) • Also “Importance” of hearing in these 13 listening situations (0-3 point scale) • Not important (0) to very important (3) • Score = Satisfaction x importance • Total score = Sum (all situations x need)/Total possible score
Quantifiable COSI - Strong Predictor of Perception of Benefit
U.S. Customer Satisfaction TrendsNo significant differences (H.A. 1-5 years.)
U.S. Customer Satisfaction New Hearing Instruments (<1 year) • Declines (+5%) • Battery life • Adjust. V.C. • Value ($$/performance) • Gains (+5%) • Visibility • Localization • Outdoors • Place worship • Telephone • Post fitting service
Customer Satisfaction Trends • MarkeTrak V significantly higher than: • MarkeTrak IV (1994) : • 23 of 33 items (p<.01) • MarkeTrak III (1991): • 4 of 33 items (p<.01)
Customer Satisfaction Trends • Key improvements (1997 vs.1991 & 1994): • Outdoor enjoyment • Phone usage • Value • Explain care of hearing aids • Visibility ratings are lower than in 1991
The introduction of CICs Probably Caused Post-purchase Cognitive Dissonance with Visibility of Instrument
Satisfaction Segmentation • by type of hearing loss • by style of hearing aid • Programmable/non-programmable • Telecoil • Hearing aids without volume controls • New user versus repeat user • Binaural versus monaural
Satisfaction by Style of Hearing Aid • CIC rated superior on 15 attributes. • Visibility • Comfort with loud sounds • Listening situations (7 of 13) • Telephone, Outdoors, workplace, Groups, restaurant • CIC rated lower on battery life, V.C. • 34% w/o a V.C. want one
Satisfaction by Style of Hearing Aid • BTE rated significantly lower: • Ability to hear soft sounds • Difficult listening situations • Tell direction of sounds • BTE rated higher • Hours worn • Battery life • Are lower ratings due to degree of loss?
Customer Satisfaction by Perceived Level of Hearing Loss • Mild loss significantly lower on 13 attributes • Quality of life • Likelihood of repurchase/recommend HA • Wearing of aids • Perception of benefit • One-on-one communication
Customer Satisfaction by Perceived Level of Hearing Loss • Profound lower on 15 attributes: • Perceived benefit • Fit and comfort • Ability to hear soft sounds • Localization • Whistling/feedback • Nearly all listening situations • Yet, they give the highest overall rating.
What about the volume control? • 9% report they have none. • 37% want one. • Big differences on satisfaction. • Should make sure consumer can live without a volume control.
New Users More likely to be Dissatisfied with Their Experience • 54% overall satisfaction new users • versus 63% for repeat users • New users rate 16 items lower • Quality of life (-21) • Recommend hearing aids (-12) • Repurchase , reliability (-10) • Battery life (-8) • New users rate 5 items higher • Able to hear soft sounds (+10), Large group (+7)
Key Findings • Modest improvements since 1991 • Major improvements since 1994 • Strong advantage in favor of • Programmable • Telecoil • Binaural • CIC • Mild hearing loss & new users less satisfied
Key Findings • CIC introduction - probable negative impact on larger instrument satisfaction. • Lack of a VC could depress satisfaction for some segments of users. • Importance of: • Counseling time spent with consumer • Multiple environmental listening utility (MELU) • Volume control to some users of CICs
Methodology • Consumers who own a hearing aid but NEVER wear it = hearing aid in the drawer. • Hearing aids in drawer = 16.2% respondents. • Told to explain why non-use in MarkeTrak survey. • Received 348 letters. • Content coding yielded 567 comments.