Download
1 / 25
250 likes | 476 Vues
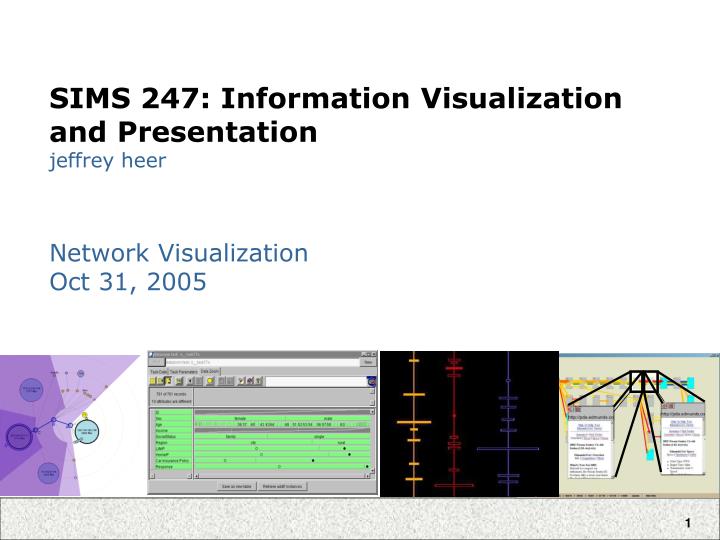
SIMS 247: Information Visualization and Presentation jeffrey heer. Network Visualization Oct 31, 2005. today. design review graph visualization specifically graph layout case study: vizster online social network visualization happy halloween. design review. Each group, come up and share

E N D
SIMS 247: Information Visualization and Presentationjeffrey heer Network Visualization Oct 31, 2005
today • design review • graph visualization • specifically graph layout • case study: vizster • online social network visualization • happy halloween
design review • Each group, come up and share • What aspect(s) where you trying communicate? • What visual mappings did you consider?
Graphs and Trees • Graphs: • Representations of structured, connected data • Consist of a set of nodes (data) and a set of edges (relations) • Edges can be directed or undirected • Trees: • Graphs with a specific structure • connected graph with n-1 edges • Representations of data with natural hierarchy • Nodes are either parents or children
When is Graph Visualization Applicable? • Ask the question: is there an inherent relation among the data elements to be visualized? • If YES – then the data can be represented by nodes of a graph, with edges representing the relations. • If NO – then the data elements are “unstructured” and goal is to use visualization to analyze and discover relationships among data. Source: Herman, Graph Visualization and Navigation in Information Visualization: a Survey
Common Applications • Process Visualization (e.g., Visio) • Dependency Graphs • Biological Interactions (Genes, Proteins) • Computer Networks • Social Networks • Simulation and Modeling
Graph Layout • How to position the nodes and edges? • The primary concern with networks • while inheriting other issues such as color, size, etc • The topic of the Graph Drawing conference (as well as numerous InfoVis papers) and even multiple books.
The Billion $$ Application Integrated Circuits
Traditional Graph Drawing poly-line graphs (includes bends) orthogonal drawing planar, straight-line drawing upward drawing of DAGs
Traditional Graph Drawing • Optimization based on a set of criteria • (mathematical aesthetics) • Minimize edge crossings • Minimize area • Maximize smallest angle • Maximize symmetry • BUT, can’t do all at once • Often unsuitable for interactive visualization • Many optimizations are NP-Hard (runs ~forever) • Approximation algorithms very complex • Unless you only need to compute layout once • Precompute layout, or compute once at the beginning of an application then support interaction
Layout Approaches • Tree-ify the graph - then use tree layout • Hierarchical graph layout • Optimization-based techniques • Adjacency matrices • Structurally-independent layout • (this list is not meant to be exhaustive)
Tree-based graph layout • Select a tree-structure out of the graph • Breadth-first-search tree • Minimum spanning tree • Other domain-specific structures • Use a tree layout algorithm • Benefits • Fast, supports interaction and refinement • Drawbacks • Limited range of layouts
Hierarchical graph layout • Use directed structure of graph to inform layout • Order the graph into distinct levels • this determines one dimension • Now optimize within levels • determines the second dimension • minimize edge crossings, etc • The method used in graphviz’s “dot” algorithm • Great for directed acyclic graphs, but often misleading in the case of cycles
Hierarchical Graph Layout • Evolution of the UNIX operating system • Hierarchical layering based on descent
Hierarchical graph layout Gnutella network
Optimization-based layout • Specify constraints for layout • Series of mathematical equations • Hand to “solver” which tries to optimize the constraints • Examples • Minimize edge crossings, line bends, etc • Multi-dimensional scaling (preserve multi-dim distance) • Force-directed placement (use physics metaphor) • Benefits • General applicability • Often customizable by adding new constraints • Drawbacks • Approximate constraint satisfaction • Running time; “organic” look not always desired
Example: Force-Directed Layout Uses physics model to layout graph Nodes repel each other, edges act as springs, and some amount of friction or drag force is used visual thesaurus - plumbdesign
Hybrid approaches also possible • Dig-CoLa algorithm • “Directed Graph Constraint Optimization Layout”? • Determines hierarchy levels • Then uses this as additional constraints to an optimization-based layout • InfoVis 2005 Best Paper
Typical Sugiyama layout (dot) - preserves tree structure Our method - preserves edge lengths slide borrowed from Tim Dwyer
slide borrowed from Tim Dwyer Examples
Adjacency Matrices • So far, only looked at node-link diagrams • Often doesn’t scale well due to edge-crossings, occlusion, etc. --> hard to read • One solution: adjacency matrix • show graph as table • nodes as rows/columns • edges as table cells • (We’ll read a study of this approach later on…)
Structurally-Independent Layout • Simple. Just ignore the graph structure. • Base the layout on other attributes of the data • Examples: • Geography • Time • Benefits • Often very quick layout • Optimizes communication of particular features • Drawbacks • May or may not present structure well
Structurally Independent Layout • The “Skitter” Layout • Internet Connectivity • Angle = Longitude • geography • Radius = Degree • # of connections Skitter, www.caida.org