Download
1 / 23
230 likes | 415 Vues
Applying the Technique: A six-step process. Presentation given: SRM Annual Meeting Casper, WY February 2003. Applying the Technique Six Steps. Identify the Evaluation Area Obtain or develop Reference Worksheet Obtain or develop Evaluation Matrix Complete characterization worksheets

E N D
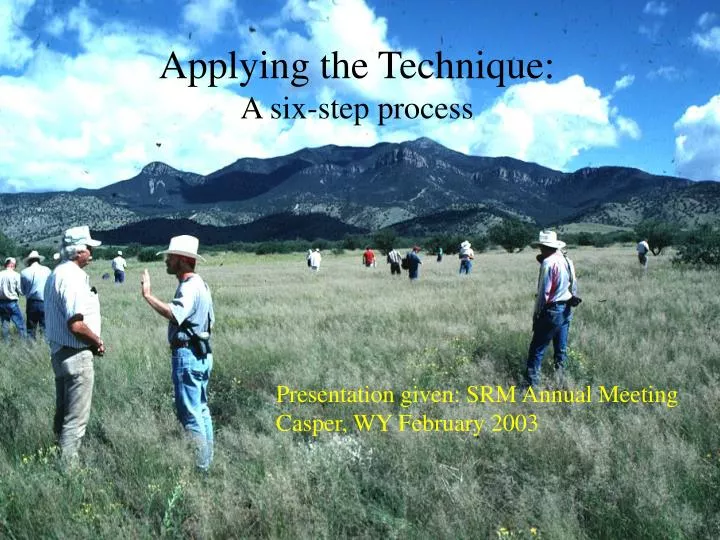
Applying the Technique: A six-step process Presentation given: SRM Annual Meeting Casper, WY February 2003
Applying the TechniqueSix Steps • Identify the Evaluation Area • Obtain or develop Reference Worksheet • Obtain or develop Evaluation Matrix • Complete characterization worksheets • Rate 17 indicators • Rate the 3 Rangeland Health Attributes
Steps in the Technique Step 1. Identify evaluation area, verify soil and ecological site information Ecological Site Reference sheet available from internet/NRCS? No Yes Stop Step 2. Develop Ecol. Site Reference sheet. Visit Ref. Area to aid development of Ref. sheet Continue
Indicator Evaluation Matrix available from internet/NRCS? No Yes Stop Step 3. Develop Site-specific Evaluation Matrix Based on Ecol. Site Reference sheet Step 4. Complete cover & Functional/structural worksheets(& optional quantitative data) Step 5. Rate 17 indicators on Evaluation Worksheet and justify all ratings with written comments Step 6. Evaluate 3 rangeland health attributes based on the ratings of the 17 indicators
Assemble Useful Resources • Maps or GIS themes • Topographic or Digital Elevation Map • Aerial Photography or Digital Ortho Qtr. Quad. • Soil Maps • Soil Survey • Species lists • Ecological (Range) Site Descriptions
Steps in the Technique Step 1. Identify evaluation area, verify soil and ecological site information Ecological Site Reference sheet available from internet/NRCS? No Yes Stop Step 2. Develop Ecol. Site Reference sheet. Visit Ref. Area to aid development of Ref. sheet Continue
Step 1 – Identify Evaluation Area • Slope, aspect, elevation, topographic position • Verify soil • Soil pit • Surface Texture • Depth to restrictions • Diagnostic horizons • Verify ecological site • Soil & Climate
Rangeland Health Evaluation Worksheet Aerial Photo: . Management Unit_Randy Rancher_ State _NM_ Office _Las Cruces_ Range/Ecol. Site Code: 042XB999NM_ (Allotment or pasture) Ecological Site Name:___Limy________________Soil Map Unit/Component Name:_Nickel gravelly fine sandy loam Observers: ____Joe Smith, Jose Garcia and Thaddeus Jones__________________________ Date: _June 10, 2002 Location (description):___Limy site two miles north of windmill in S.E. pasture_________________________________ T. _11 SR. _23 Wor _____________N. Lat.OrUTM E_________________mPosition by GPS? Y / N No UTM Zone____, Datum______ Sec. _12__, _NE__ 1/4 _____________W. Long.N_________________mPhotos taken? Y / N Yes Size of evaluation area ___Evaluation area is approximately 3 ac. and represents entire ecological site in this pasture Soil / site verification: Range/Ecol. Site Descr., Soil Surv., and/or Ecol. Ref. Area: Evaluation Area: Surface texture _grfsl, grlfs, glSurface texture _gfsl__________ Depth: very shallow __, shallow __, moderate __, deep _X_Depth: very shallow __, shallow __, moderate __, deep _X_ Type and depth of diagnostic horizons: Type and depth of diagnostic horizons: 1. _Calcic horizon w/in 20”3. _________________ 1. Calcic Horizon at 15” 3. ___________________ 2. ___________________________ 4. _________________ 2. ___________________ 4. ___________________ Surf. Efferv.: none, v. slight, slight, strongX, violentSurf. Efferv.: none, v. slight, slight, strongX, violent__ Parent material _Alluvium Slope_0-5_%Elevation _4100_ft.Topographic position _toeslope_________Aspect _south_ Average annual precipitation _8-12_inches Seasonal distribution _Summer thunderstorms dominate_____ Recent weather (last 2 years)(1) drought ___, (2) normal __X__, or (3) wet _____. Wildlife use, livestock use (intensity and season of allotted use), and recent disturbances: Wildlife use is dominated by pronghorn antelope in the winter. Livestock use was extremely heavy yearlong during the 1900-1930. Last 50 years, livestock use has been cow/calf moderate yearlong use. Off-site influences on evaluation area: __None________________________________________________________________________________ Criteria used to select this particular evaluation area as REPRESENTATIVE(specific info. And factors considered; degree of “representativeness”) _Area is located near a pasture key area. It is located in the center of the ecological and represents the typical amount of livestock, wildlife and recreational uses on this area. This ecological site dominates this pasture. The area is ¾ of a mile from the closest water source._______________ _______________________________________________________________________________________________________________________ Other remarks (continue on back if necessary) _______________________________________________________________________________________________________________________ Reference: (1) Ecological Reference Worksheet:__Limy SD – 42B__; Author: _J.Christensen_____; Creation Date: _03/23/2002 or(2) Other (e.g. name and date of ecological site description, locations of ecological reference area(s))____Limy Ecological Site 042XB999NM June 2001_____.
Steps in the Technique Step 1. Identify evaluation area, verify soil and ecological site information Ecological Site Reference sheet available from internet/NRCS? No Yes Stop Step 2. Develop Ecol. Site Reference sheet. Visit Ref. Area to aid development of Ref. sheet Continue
Step 2 – Reference Worksheet • What is it? • Describes the expected variation for each of the 17 indicators • Incorporates variation among vegetation phases in an Ecological State that is resistant & resilient to disturbance • Ecological site-specific • Develop • Assemble resources (maps, data, etc.) & group of experts • Reach consensus on each indicators description • Obtain • In future, from NRCS State Office or web at http://plants.usda.gov/ & follow links to ESIS (Ecological Site Information System).
Ecological Reference Worksheet Author(s)/participant(s): J. Christensen, B. Call, B. Bestelmeyer, R. Placker, D. Trujillo, L. Hauser, D. Coalson, P. Smith, & J. Herrick Contact for lead author: __jchristensen@web.com/334-556-7890_____________ Reference site used? Yes/No: No Date: 03/23/2002 MLRA: __42__ Ecological Site: ____Limy__This must be verified based on soils and climate (see Ecological Site Description). Current plant community cannot be used to identify the ecological site. Indicators.For each indicator, describe the potential for the site. Where possible, (1) use numbers, (2) include expected range of values for above- and below-average years for each community within the reference state, when appropriate & (3) cite data. Continue descriptions on separate sheet. 1. Number and extent of rills:None 2. Presence of water flow patterns:None, except following extremely high intensity storms, when short (less than 1 m) flow patterns may appear; minimal evidence of past or current soil deposition or erosion. 3. Number and height of erosional pedestals or terracettes:None 4. Bare ground from Ecological Site Description or other studies (rock, litter, lichen, moss, plant canopy are not bare ground): 20 – 30 % bare ground; bare patches should be less than 8-10 inch diameter; occasional 12 inch patches associated with shrubs. Larger bare patches also associated with ant mounds and rodent disturbances 5. Number of gullies and erosion associated with gullies: None 6. Extent of wind scoured, blowouts and/or depositional areas: None 7. Amount of litter movement (describe size and distance expected to travel):Minimal and short, associated with water flow patterns following extremely high intensity storms. Litter also may be moved during intense wind storms 8. Soil surface (top few mm) resistance to erosion (stability values are averages – most sites will show a range of values):Stability class (Herrick et al. 2001) anticipated to be 5-6 at surface and subsurface under vegetation and 4-5 at surface and subsurface in the interspaces. These values need verification at reference sites.
Indicator Evaluation Matrix available from internet/NRCS? No Yes Stop Step 3. Develop Site-specific Evaluation Matrix Based on Ecol. Site Reference sheet Step 4. Complete cover & Functional/structural worksheets(& optional quantitative data) Step 5. Rate 17 indicators on Evaluation Worksheet and justify all ratings with written comments Step 6. Evaluate 3 rangeland health attributes based on the ratings of the 17 indicators
Step 3 – Evaluation Matrix • What is it? • Narrative description of 5 rating categories for each of the 17 indicators – Ecological site-specific • Generic description is included • Develop • Use same group of experts & Reference Worksheet • Reference Worksheet description fits None-to-Slight • Reach consensus on each descriptions of each rating category • Obtain • In future, from NRCS State Office or web at http://plants.usda.gov/ & follow links to ESIS (Ecological Site Information System).
Fill-in narratives for remaining 4 classes Add text from Reference Worksheet to None-to-Slight
Indicator Evaluation Matrix available from internet/NRCS? No Yes Stop Step 3. Develop Site-specific Evaluation Matrix Based on Ecol. Site Reference sheet Step 4. Complete cover & Functional/structural worksheets(& optional quantitative data) Step 5. Rate 17 indicators on Evaluation Worksheet and justify all ratings with written comments Step 6. Evaluate 3 rangeland health attributes based on the ratings of the 17 indicators
Step 4.Develop Functional/Structural Groups Appendix 5
Step 4 – Cover Appendix 3 Appendix 4
1 2 3 4 5 6 7 8 9 10 A C A D C B Bare Soil Litter Rocks Litter Points for Cover hits
Indicator Evaluation Matrix available from internet/NRCS? No Yes Stop Step 3. Develop Site-specific Evaluation Matrix Based on Ecol. Site Reference sheet Step 4. Complete cover & Functional/structural worksheets(& optional quantitative data) Step 5. Rate 17 indicators on Evaluation Worksheet and justify all ratings with written comments Step 6. Evaluate 3 rangeland health attributes based on the ratings of the 17 indicators
Step 5 – Rate the 17 indicators • Complete reconnaissance • Use Evaluation Matrix • Teams preferred • Rate each deviation: • None-to-Slight • Slight-to-Moderate • Moderate • Moderate-to-Extreme • Extreme • Record comments
Indicator Evaluation Matrix available from internet/NRCS? No Yes Stop Step 3. Develop Site-specific Evaluation Matrix Based on Ecol. Site Reference sheet Step 4. Complete cover & Functional/structural worksheets(& optional quantitative data) Step 5. Rate 17 indicators on Evaluation Worksheet and justify all ratings with written comments Step 6. Evaluate 3 rangeland health attributes based on the ratings of the 17 indicators
Step 6 – Rate Attributes • Record the Indicator number in Attribute Category • Rate Attribute based on Preponderance of Evidence • Not merely mean or mode • Some indicators may be weighted • Document your justification
Intended Applications • Designed to be used: • By knowledgeable, experienced people • As preliminary evaluation of attributes • For identification of areas at risk of degradation • As a communication tool for Rangeland Health • NOT to be used: • To identify causes of problems • Solely for management decisions • To monitor trend • As a stand-alone national assessment