Download

1 / 32
320 likes | 483 Vues
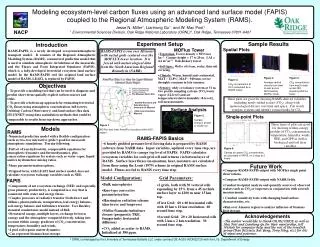
NACP. On network design for the detection of urban greenhouse gas emissions: Results from the Indianapolis Flux Experiment (INFLUX).

E N D
NACP On network design for the detection of urban greenhouse gas emissions: Results from the Indianapolis Flux Experiment (INFLUX) Natasha Miles1, Thomas Lauvaux1, Kenneth Davis1,Scott Richardson1, Laura McGowan1, Daniel Sarmiento1, ColmSweeney2, Anna Karion2, Michael Hardesty2, Jocelyn Turnbull2,3, Laura Iraci4, Kevin Gurney5, Igor Razlivanov5, Paul Shepson6, M. ObimindaCambaliza6,James Whetstone7 1. The Pennsylvania State University, 2. NOAA/ESRL, 3. GNS Science 4. NASA/JPL, 5. Arizona State University, 6. Purdue University, 7. NIST AGU Fall Meeting A44F-01 San Francisco, CA 12 December 2013
INFLUX motivation • Emissions mitigation will happen at local and regional scales. • Validation of emissions mitigation will(?) require (independent) measurements • Atmospheric GHG measurements have the potential to provide such independent emissions estimates.
INFLUX objectives • Develop improved methods for determination of urban area-wide emissions, and spatially and temporally-resolved fluxes of greenhouse gases, specifically, CO2 and CH4. • Determine and minimize the uncertaintyin the emissions estimate methods.
INFLUX methodology: Simultaneousapplication of multiple methods • Inventory estimates of sector-by-sector emissions at high spatial resolution • Periodic aircraft flights with CO2, CH4, and flask samples • Periodic automobile surveys of CH4 • 12 surface towers measuring CO2, 5 with CH4, and 5 with CO & Mesoscale atmospheric inversion • 6automated flask samplers from NOAA • Identify sectoralemissions • Intensive study of diurnal cycle planned • TCCON-FTS for 4 months (Sept - Dec 2012) • 4 eddy-flux towers – model assessment (installed Nov 2013) • Doppler lidar (installed Apr 2013) • Tracer release experiment (?)
Vulcan and Hestia Emission Data Products 250m res - Indy Vulcan – hourly, 10km resolution for USA Hestia: high resolution emission data for the residential, commercial, industrial, transportation and electricity production sectors. http://hestia.project.asu.edu/ A53E-0216. Gurney et al, Friday afternoon
Aircraft mass balance approach: 1 June 2011 Flight path Cambaliza et al 2013 (ACPD)
1 June 2011 Results 8 ppm CO2 26,000 moles s-1 50 ppb CH4 197 moles s-1 A53E-0225. Quantification of the methane emission flux from the city of Indianapolis, IN: identification and contribution of sources, Cambalizaet al., Friday afternoon Cambaliza et al2013 (ACPD)
Drive-arounds: Separation/quantification of CH4 sources North Instrumented vehicles used to identify and quantify individual sources. NG leak CH4 enhancement (ppb) Observed CH4enhancements directly downwind of SSLF landfill and a natural gas TRS on Harding St. obtained during a surface mobile measurement on Jan. 21, 2013. Note that a NG leak was also observed on Oliver Ave. Bridge just outside the city center. Courtesy of M. O. Cambaliza (Purdue Univ).
Data shown: • Total INFLUX drive paths and methane enhancements (CSU 2013, Purdue 2012-2013) • ***Threshold set to show CH4 data > 3 stdev above average background Marion County Key: Drive Path Courtesy of M. O. Cambaliza (Purdue Univ)
Marion County Panhandle • Data shown: • Total INFLUX drive paths and methane enhancements (CSU 2013, Purdue 2012-2013) Residential Leak Oliver Ave Bridge TRS #2 Key: Drive Path x40 x9 x29 SSLF See also: A53E-0213. Quantification of Methane Emissions From Street Level Data, Prasad et al,Friday afternoon; Courtesy of M. O. Cambaliza (Purdue Univ)
Results to date: Tower flask and in-situ Mesoscale atmospheric inversion Picarro, CRDS sensors; NOAA automated flask samplers; Communications towers ~100 m AGL 10 km
Checks of network intercalibration: CO2WMO recommendation: 0.1 ppm Round-robin testing using 3 NOAA-calibrated tanks (Nov 2013) CADS (first generation) systems (circled): -0.18 to 0.1 ppm average site error In-situ – flask comparison at 5 INFLUX sites (ongoing) • NOAA 1 hour integrated flask samples • Mean value in-situ - flask: • CO2: 0.09 ppm CH4: 0.6 ppb CO: -4.1 ppb • Within WMO recommendations (urban)
Flask analysis: fossil fuel CO2 Flask results: C14 Turnbull et al., in prep
Sector-by-sector atmospheric CO2 mole fractions, in percentage contribution for each site Commercial Industrial Mobile Residential Power Plant • Winter mean daytime [CO2] • Hestia emissions combined with footprint analysis
Comparison of [CO2] at INFLUX sites • Afternoon [CO2] with 21-day smoothing • Site 03 (downtown): high [CO2] • Site 01 (background): low [CO2] • Seasonal and synoptic cycles are evident 2011 2012 2013
Comparison of [CO2] at INFLUX sites • Afternoon [CO2] with 21-day smoothing • Site 03 (downtown): high [CO2] • Site 01 (background): low [CO2] • Seasonal and synoptic cycles are evident
Comparison of [CO2] at INFLUX sites Afternoon daily [CO2] 2011 2012 2013
Comparison of [CO2] at INFLUX sites Range = 10 ppm 3 ppm
CO2 range as a function of wind speed Observations: CO2 range amongst INFLUX sites
CO2 range as a function of wind speed Observations: CO2 range amongst INFLUX sites 10% of ranges are > 10 ppm 29% of ranges are < 3 ppm Increased residence time (at low winds) tends to increase the CO2 range
CO2 range as a function of wind speed Observations: CO2 range amongst INFLUX sites Model: Difference along domain-averaged wind direction Increased residence time (at low winds) tends to increase the CO2 range
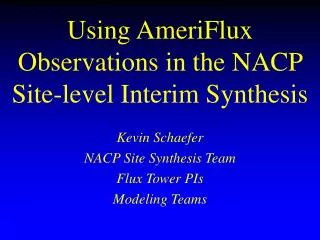
Spatial Structure of Urban CO2Average [CO2] above background site • Site 09 measures 0.3 ppm larger than Site 01 • Site 03 (downtown site) measures larger [CO2] by 3 ppm Eastern edge of city Downtown East of city Afternoon daily values, 1 Jan – 1 April 2013
Spatial structure: Model-data comparison Average [CO2] above background site • Backward model results using footprints and Hestia 2002 fluxes • Agreement in terms of the ordering of the sites • Observations are 25% higher than modeled values, on average
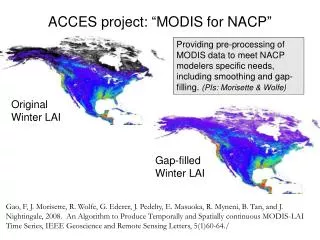
Urban [CO2] enhancement Jan – Apr 2013 AFTERNOONSite 02 – Site 01 CO2, ppm Eastern edge of city - background Average over all wind dir: 1.5 ppm Downwind of city: 2.4 ppm ** Arrows point to sources
Urban [CO2] enhancement Jan – Apr 2013 AFTERNOONSite 02 – Site 01 CO2, ppm Jan – Apr 2013 AFTERNOONSite 09 – Site 01 CO2, ppm Site 30 km east of edge of city - background site Average over all wind dir: 0.3 ppm Downwind of city: 1.1 ppm ** Arrows point to sources ** Black: Site 01 larger than Site 09 Eastern edge of city - background Average over all wind dir: 1.5 ppm Downwind of city: 2.4 ppm ** Arrows point to sources
How high do in-situ measurements need to be?What is the vertical structure of urban CO2 mole fractions?
Vertical profiles of daytime CO2, compared to top level Background site Mixed site Downtown site -0.60.2 0.9 1.0 -1.00.3 1.3 3.4
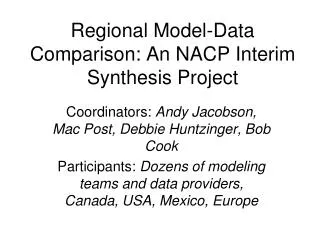
Vertical CO2 (Daytime) DifferencesSite 02 – Mixed site CO2 at 10 m – CO2 at 136 m Mixed Site Arrows point to sources
Vertical CO2 (Daytime) DifferencesSite 02 – Mixed site CO2 at 10 m – CO2 at 136 m Mixed Site Arrows point to sources Source area varies for various heights
Vertical CO2 (Daytime) DifferencesSite 03 – Downtown site CO2 at 10 m – CO2 at 54 m Downtown Site Arrows point to sources
Vertical CO2 (Daytime) DifferencesSite 03 – Downtown site CO2 at 10 m – CO2 at 54 m Downtown Site • “Spaghetti bowl” • How well does the model do for this site? Arrows point to sources
NACP Conclusions • Whole city flux estimates achieved via aircraft mass balance. Drive-arounds used for source identification. • Flask: Winter, CO2 = CO2ff. Summer, not true. • Tower observations detect a clear urban signal in both CO2 (buried amid lots of synoptic “noise”).Differences vary greatly with weather conditions. • Model-data comparisons show similar spatial structure. • For more information, see http://influx.psu.edu