Download
1 / 6
60 likes | 194 Vues
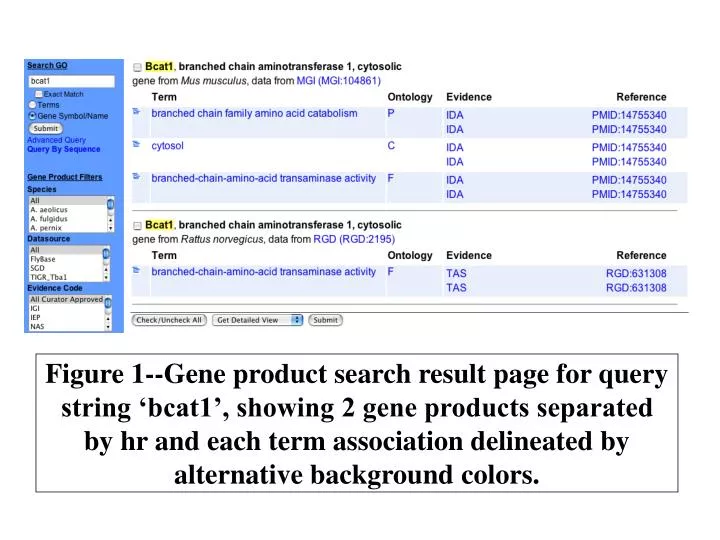
Figure 1--Gene product search result page for query string ‘bcat1’, showing 2 gene products separated by hr and each term association delineated by alternative background colors. Figure 4--Showing a term parents, siblings and children. Figure 5--Partial view of a term ancestors.

E N D
Figure 1--Gene product search result page for query string ‘bcat1’, showing 2 gene products separated by hr and each term association delineated by alternative background colors.
Figure 6A--Number of gene products (in thousands) in database with IEA data (GO) and without IEA (GOLite) Figure 6B--Number of Associations (in millions) in database with IEA data (GO) and without IEA (GOLite)
Figure 11--Prototype of term auto-completion, showing a popup list containing terms matching ‘centro’ string.
Figure 12--Ontology inference. Top shows part_of relationship of the term ‘Srb-mediator complex’ to root and left shows mixed relationships of the same term.