Download
1 / 14
140 likes | 252 Vues
Connecting All Americans Link Hoewing VP, Internet and Technology Policy July 15, 2007. Broadband Penetration Rankings – By Household. Key Takeaways: US Internet & Broadband Adoption Significantly Higher than EU Overall Internet US 70% vs. EU 39% Broadband US 42% vs. EU 23%

E N D
Connecting All Americans Link Hoewing VP, Internet and Technology Policy July 15, 2007
Broadband Penetration Rankings – By Household Key Takeaways: • US Internet & Broadband Adoption Significantly Higher than EU Overall • Internet US 70% vs. EU 39% • Broadband US 42% vs. EU 23% • On a state-by-state basis: • The most penetrated US states compare favorably with the most penetrated EU countries (US States would be 8 of the top 10) • The least penetrated US states are above the EU average (23%). US50: 70% Internet, 42% Broadband Source: Pew Internet & American Life Project, “Home Broadband Adoption 2006”, May 28, 2006 EU25: 39% Internet, 23% Broadband Source: European Commission, “E-Communications Household Survey”, July 2006 Top 3 US States State Data Source: Render Vanderslice & Associates, September 2006 Bottom 3 US States Page 2
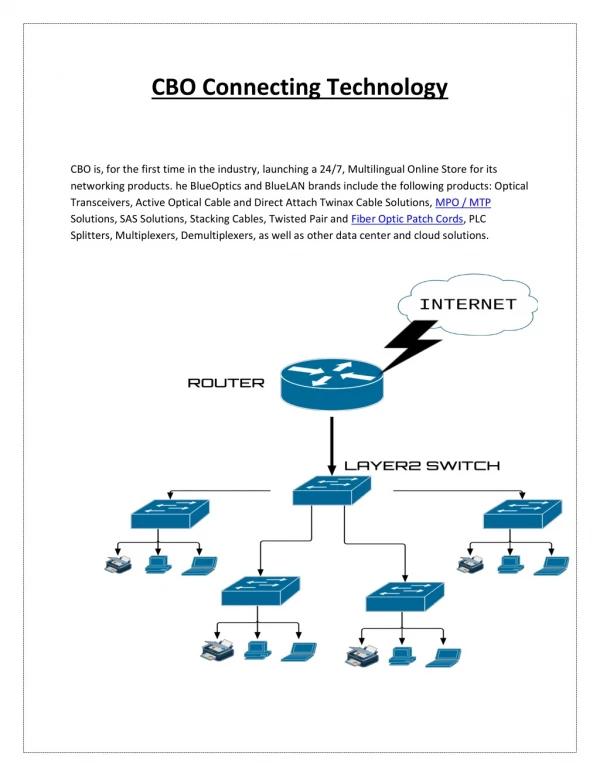
Platform Competition – Lacking in Europe European Competitive Telecom Association (ECTA), ‘Scorecard’ 1st quarter 2006. The majority of European markets have a small non-DSL infrastructure, and cable penetration – particularly – for most of Europe is at less than 21%. Unbundling of DSL throughout the EU is, in large part, to compensate for a lack of platform competition.
Record Year for BB Growth • 20 largest cable and telco providers in the U.S. combined added over 10.2 million new BB subscribers in 2006 • For 2006, Verizon added 1.8 million new BB subscribers • These providers now serve over 53.3 million BB subscribers, with cable controlling ~55% Source: Leichtman Research Group
Today’s U.S. Broadband Market is Highly Competitive Most households can get broadband: 82% DSL 94% Cable 50,000 WiFi Hotspots exist nationwide Broadband over powerline now competing in dozens of locations The percent of households subscribing to broadband has exploded: More than 50% of all homes have broadband Carriers are offering lower entry prices for their broadband services: Verizon offers $14.95 DSL Mobile carriers have introduced new services and networks: EVDO (700 kbps average speed) available to 255 million Americans Carriers are improving the high-speed options available to customers: Verizon FiOS 50 Mbps Cablevision 16 Mbps
Customer Time Spent in Selected Forms of Electronic Communication Consumers daily total use is 5.25 hours! Multitasking plays a role. No one form dominates. Sources: (1) “Multitasking Drives Consumer Consumption of Media”, Yankee Group, Jan 26, 2007, Exhibit 1 "Average Media Consumption (Hours per workday) in the United States… " (excerpts) (2) Households in US, 2005 - www.census.gov/population/socdemo/hh-fam/hh1.xls (shows 113M HH in 2006) (3) “The VoIP Evolution Continues: Forecasting Broadband VoIP and Cable Telephony”, Yankee Group, Aug 2006, Exhibit 3 shows 8.5M VoIP HHs (4) “Worldwide Email Usage 2005-2009 Forecast”, IDC, Dec 2005, Table 15 North American and Worldwide Average Daily Person to Person Email Messages Sent – shows 11.97 person to person emails sent. (5) “Daily Internet Activities”, www.pewinternet.org/trends/Daily_Internet_Activities_1.11.07.htm shows 93M Adults use the Internet on any given day.
Verizon’s Broadband Strategy Includes . . . • Fiber-to-the-premises (FTTP) • Next generation network technology • 9 million homes passed by end of 2007 • 5/2 Mbps; 15/2 Mbps; 30/5 Mbps; 50/5 Mbps (in some markets) – Advancing now to GPON and potentially 100s of megabytes to homes • DSL • Continue to deploy as ubiquitous data network • Speeds of 768 kbps and 3 megabytes available • Deployed to over 80 percent of all our customers • Wireless • 3G deployed today • 255 million Americans (5/6s) can access today • Up to 700 kbps on average available • EVDO Rev A now being deployed in dozens of cities with upload speeds in particular several times higher than current EVDO • Moving toward 4G - other wireless technologies (WiMax) in trials
Verizon FiOS Strategy Verizon CapEx spending on FiOS will total of $23 billion by 2010 • FiOS – began in 2005 – an all-digital fibre-optic network that extends to the customers’ premises (FTTH / FTTP) • FiOS TV – now offered in 400 cities to over 3.5 million customers • “Triple play” – also supports voice and high-speed Internet at up to 100/10 Mbps in more than 1,600 cities in 16 states • More capacity for digital & HDTV, and unparalleled IP bandwidth for on-demand & niche programming • Unprecedented interactivity to support new business opportunities in voice, data, video, conferencing, etc. 2Q’07 Deployment Status: • Over 7 M premises passed • 1 M FiOS high speed customers • 350,000 plus FiOS TV customers • Nearly 1 million TV customers in total (satellite/FiOS) 2007 Deployment Objectives: • Pass 9M premises passed 2010 Deployment Objectives • Pass 18M premises by 2010 What is Verizon Doing? Page 9 FTTH/FTTP Update – April 1, 2007
Percent of Residents with No Choice inInternet Service Source: Pew Internet and Society Project
Connect Kentucky – the Model • Private-public partnership managed by a non-profit organization • Trust, reliance on private sector wherever possible • Focus on BOTH supply and demand – build it and they will come not enough • Must find out where the “holes” are where broadband is not – mapping • Work with companies to get data – strong non-disclosure agreement and non-profit not subject to FOIA • Develop effective GIS mapping system • Continuously report progress to political leaders • Create eCommunity leadership teams • Teams consist of local members from nine different groups (listed in next slide) • Conduct economic and business analysis • Promote deployment – focused on private players first • Aggregated demand and market analysis developed through eCommunity work • Private players may decline and if so, other options – including RUS loans working with local governments – are used
The Connect Kentucky Model Works Kentucky has reached 42% penetration of broadband Kentucky went from among the bottom states on deployment to one of the top five Kentucky will be at 100% deployment by year’s end
Connect Kentucky Model Produces Results • U. S. model – platform competition, remove constraints on investment – has worked and is working • Mapping is important but it alone does not produce results • In fact it can be harmful if not linked to effective programs focused on encouraging deployment and use • Non-profit led, private-public partnership is results focused • Community based with objective to “fill the holes” • Data comes in many formats – gathering it and effectively teasing out key conclusions is not easy • GIS systems are almost rocket science • Focusing on the demand/uptake side of the equation is critical too • Connect Kentucky results speak for themselves