Download
1 / 17
180 likes | 345 Vues
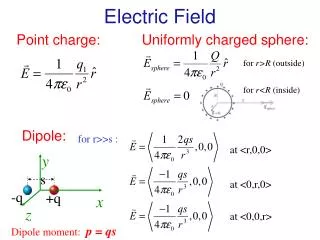
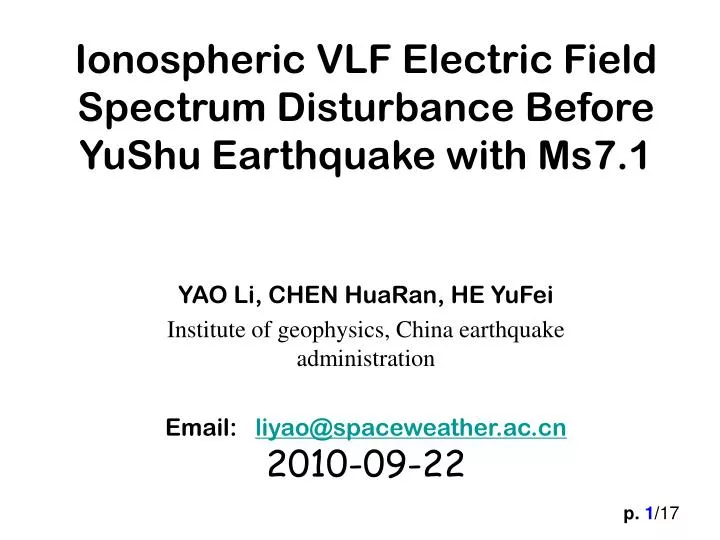
Ionospheric VLF Electric Field Spectrum Disturbance Before YuShu Earthquake with Ms7.1. YAO Li, CHEN HuaRan, HE YuFei Institute of geophysics, China earthquake administration Email: liyao@spaceweather.ac.cn 2010-09-22. contents. Information of Yushu earthquake Data :

E N D
Ionospheric VLF Electric Field Spectrum Disturbance Before YuShu Earthquake with Ms7.1 YAO Li, CHEN HuaRan, HE YuFei Institute of geophysics, China earthquake administration Email: liyao@spaceweather.ac.cn 2010-09-22
contents • Information of Yushu earthquake • Data : VLF(20-20K Hz) electric field spectrum of DEMETER satellite • DEMETER observations : 1.Ionosphere disturbance during 20-10 k HZ 2.Signal to noise ratio variance in 10k-20k Hz • Conclusions
Information of Yushu earthquake • date: 13 Apr. 2010. • Area: YUSHU, QINGHAI province, China • M: 7.1 • Lat. and long.[deg]: 33.1 N, 96.7 E • Depth[km]: 10
Data VLF Electric Field spectrum data: • Frequency range: [20 – 20k Hz]. • Frequency resolution: 19.5 Hz • Time resolution: 2s • Lt: 10:30, 22:30: only the data for nighttime orbits are used
DEMETER observations • Date: 9 Apr. 2010 • Half orbit: 30880_1 • Two black dotted vertical lines:1000 km from epicenter • The horizontal lines: the signals from the VLF transmitters in the 10k–20k Hz around China • Drop of VLF power spectrum is observed in 50-200 Hz frequency region marked by the black ellipse.
(1)VLF electric field variancein 20-10k Hz Median and inter-quartile range(IQR) Method : • Higher bounds: xhigh,i=Mi+IQRi • Lower bounds: xlow,i=Mi-IQRi • Positive anomaly: observation values which are higher than higher bounds • Negative anomaly: observation values which are lower than Lower bounds
neighbourhood orbits Closest orbit MM/DD Closest orbits analysis Fig. (a) represents the closest DEMETER revisited orbit from YuShu earthquake epicenter: • Background orbits: 01/08-03/01 • Assumed disturb orbits: 03/14-04/09
Anomalous variance relate to YuShu earthquake 04/09 • X-axis:±10°in latitude from the epicenter • Black curve: median value(M) • Red curve: higher and lower bounds(M ±IQR) • Green line: observation value of assumed disturb orbit • Blue region: nagetive or positive anomaly • Negative anomalous variance appears on 9 Apr. and 27 Mar. (the top two panels) • Anomalous position: southward (equator side) of the epicenter • The orbit time is closer that of the EQ, the anomalous region is larger 03/27 03/14
neighbourhood orbits Closest orbits neighbourhood orbits analysis Fig. (b) represents the five DEMETER revisited orbits which lies in ±5°from epicenter in longitude, which are marked by L2, L1, Epi, R1, R2
Neighbourhood orbits analysis L2 • Panels from top to bottom represent the L2, L1, Epi, R1, R2, respectively • Obvious anomaly can be seen in 0°-2° region at L1, Epi, R1 orbits in the southward of the epicenter • the maximum anomaly appeared at the eastward of the epicenter L1 Epi R1 R2
2010/02/01-2010/03/05 A(f0) A(f+) A(f-) (2)the average electric field spectrum before YuShu earthquake in 10k-20k Hz Area: Long(deg):70-140E Lat(deg):10-50N Dotted blue lines: Frequency of Transmitters • SNR=2A(f0)/[A(f+)+A(f-)] • f0: transmitter frequency • f+,f-: high and low bounds • Of broadening band • A: amplitude spectrum density • df: the width of frequency band f0=19.8k Hz ,df=500 Hz f0=17.8k Hz ,df=200 Hz f0=11.9k Hz ,df=100 Hz
the SNR distribution in three re-visited periods before YuShu earthquake _NWC (19.8k Hz) Revisited period : • T1: 0306-0318 • T2: 0319-0331 • T3: 0331-0413 T1 T2 T3 • Blue circled area: • 500 Km from epicenter • A decreasing trend appears • from T1 to T3 in 2010 • SNR first drops • from T1 to T2 and then • recovers from T2 to T3 • in 2009 2010 2009
the SNR distribution of three re-visited periods before YuShu earthquake _ JP (17.8k Hz) Revisited period : • T1: 0306-0318 • T2: 0319-0331 • T3: 0331-0413 • The SNR variances are similar as those of NWC T1 T2 T3 2010 2009
the SNR distribution of three re-visited periods before YuShu earthquake _RA (11.9k Hz) Revisited period : • T1: 0306-0318 • T2: 0319-0331 • T3: 0331-0413 • The SNR variances are similar as those of NWC again. T1 T2 T3 2010 2009
results • Anomalous variance occurred in 0°-2°at eastward, westward,and southward of the epicenter about half month before the yushu earthquake during the frequency range of 50-200 Hz, and the maximum anomaly appeared at the eastward of the epicenter . • A drop of the VLF signal to noise ratio appeared in 1-25 days prior to earthquake. • These ionospheric anomalies with quite geomagnetic conditions indicate that the abnormal variances probably relate to earthquake preparation processes.