Download
1 / 1
30 likes | 187 Vues
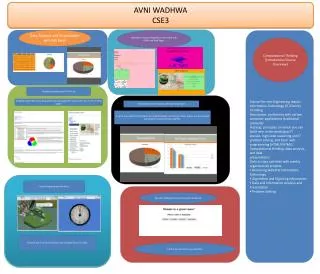
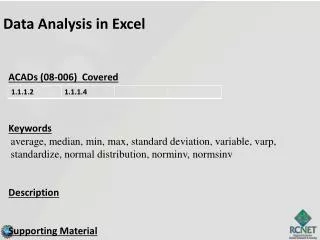
Adventures in Computational Thinking By Cindy Yang. CSE 3 Fluency with Information Technology (FIT). Data Analysis and Visualization with Excel.

E N D
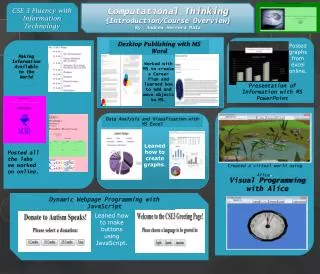
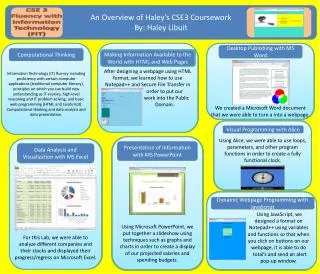
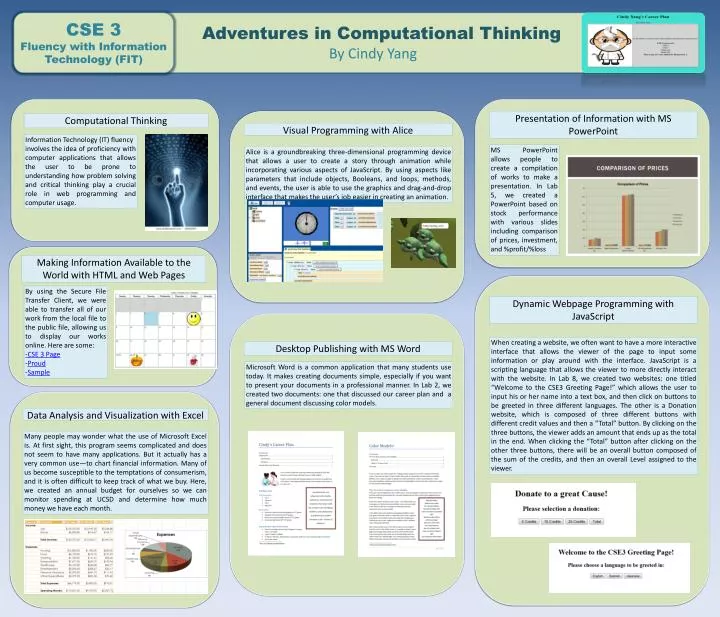
Adventures in Computational Thinking By Cindy Yang CSE 3 Fluency with Information Technology (FIT) Data Analysis and Visualization with Excel Many people may wonder what the use of Microsoft Excel is. At first sight, this program seems complicated and does not seem to have many applications. But it actually has a very common use—to chart financial information. Many of us become susceptible to the temptations of consumerism, and it is often difficult to keep track of what we buy. Here, we created an annual budget for ourselves so we can monitor spending at UCSD and determine how much money we have each month. Visual Programming with Alice Presentation of Information with MS PowerPoint Dynamic Webpage Programming with JavaScript Desktop Publishing with MS Word Computational Thinking Making Information Available to the World with HTML and Web Pages Microsoft Word is a common application that many students use today. It makes creating documents simple, especially if you want to present your documents in a professional manner. In Lab 2, we created two documents: one that discussed our career plan and a general document discussing color models. Alice is a groundbreaking three-dimensional programming device that allows a user to create a story through animation while incorporating various aspects of JavaScript. By using aspects like parameters that include objects, Booleans, and loops, methods, and events, the user is able to use the graphics and drag-and-drop interface that makes the user’s job easier in creating an animation. When creating a website, we often want to have a more interactive interface that allows the viewer of the page to input some information or play around with the interface. JavaScript is a scripting language that allows the viewer to more directly interact with the website. In Lab 8, we created two websites: one titled “Welcome to the CSE3 Greeting Page!” which allows the user to input his or her name into a text box, and then click on buttons to be greeted in three different languages. The other is a Donation website, which is composed of three different buttons with different credit values and then a “Total” button. By clicking on the three buttons, the viewer adds an amount that ends up as the total in the end. When clicking the “Total” button after clicking on the other three buttons, there will be an overall button composed of the sum of the credits, and then an overall Level assigned to the viewer. MS PowerPoint allows people to create a compilation of works to make a presentation. In Lab 5, we created a PowerPoint based on stock performance with various slides including comparison of prices, investment, and %profit/%loss Information Technology (IT) fluency involves the idea of proficiency with computer applications that allows the user to be prone to understanding how problem solving and critical thinking play a crucial role in web programming and computer usage. By using the Secure File Transfer Client, we were able to transfer all of our work from the local file to the public file, allowing us to display our works online. Here are some: -CSE 3 Page -Proud -Sample