Download
1 / 20
210 likes | 459 Vues
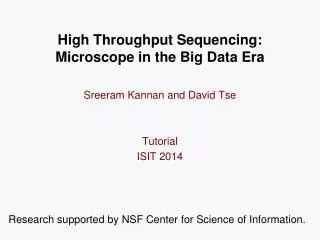
Drug Discovery in the Era of Big Data. Gregory McAllister Computational Biologist Novartis Institutes for Biomedical Research Developmental and Molecular Pathways. Cambridge global NIBR headquarters. Novartis Institutes for BioMedical Research (NIBR) Who we are.

E N D
Drug Discovery in theEraof Big Data Gregory McAllister Computational Biologist Novartis Institutes for Biomedical Research Developmental and Molecular Pathways
Cambridge global NIBR headquarters Novartis Institutes for BioMedical Research (NIBR)Who we are • Unique research strategy driven by patient needs • World-class research organization with about 5 000 scientists globally • Intensifying focus on molecular pathways shared by various diseases • Integration of clinical insights with mechanistic understanding of disease • Research-to-Development transition redefined through fast and rigorous “proof-of-concept” trials • Strategic alliances with academia and biotech strengthen preclinical pipeline | XLDB 2011 | Gregory McAllister | October 19, 2011 | XLDB | Business Use Only
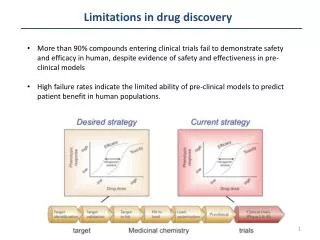
Novartis Institutes for BioMedical Research (NIBR)What we do TargetDiscovery - Pathways Antibody, siRNA and protein therapeutics Medicinal Chemistry Translational Medicine PreclinicalSafety Assay Development | XLDB 2011 | Gregory McAllister | October 19, 2011 | XLDB | Business Use Only
Novartis Institutes for BioMedical Research (NIBR)How we do it Genome Protein Networks, Molecular Pathways, are the Functional Units of the Cell Human Disease | XLDB 2011 | Gregory McAllister | October 19, 2011 | XLDB | Business Use Only
Novartis Institutes for BioMedical Research (NIBR)Developmental and Molecular Pathways • Pathway Analysis for Target Identification/Validation: • Genomics • Proteomics • Model Organisms • High-throughput Screening • Computational Biology • RNAi Technology 6 | Program Office | January 2008 | Confidential
Novartis Institutes for BioMedical Research (NIBR) Current and Future Hurdles Increasing Dimensionality of Data Increasing complexity Increasing Data Size Public and NIBR Data Biochemistry HTS Proteomics siRNA Transcriptomics Cell based screening Signature High Content Copy number NGS sequencing Mutation Exon array A doubling of sequencing output every 9 months has outpaced and overtaken performance improvements within the disk storage and high-performance computation fields. Compound Sensitivity Metabonomics S D Kahn Science 2011;331:728-729 | XLDB 2011 | Gregory McAllister | October 19, 2011 | XLDB | Business Use Only
Analytics at NIBR Where we are…what we need | XLDB 2011 | Gregory McAllister | October 19, 2011 | XLDB | Business Use Only • Standard solutions • R, Matlab, S (your programming language of choice) • SGE linux cluster • Custom code (MPI) • Analytics within a database is limited • Hadoop/Mahout • Data sizes are growing rapidly and endpoints are unclear. • Our problem lies in complex analytics on ever increasing data sizes. • Where we need to be • Systems that mimic R but work on TB size data sets. • Need a large-scale analytics system that just works • Multiple users: scientists, analysts, developers with broad range of skill sets
SciDBData Management System for Large Scale Analytics | XLDB 2011 | Gregory McAllister | October 19, 2011 | XLDB | Business Use Only • DMAS – Data Management and Analytics System • Open source • Data Model: • Nested multi-dimensional arrays • Array cells can be tuples of values or other arrays • Arrays can be sparse • Data Storage: • Arrays are “chunked” in multiple dimensions in storage • Chunks are partitioned across multiple nodes • Each node is shared nothing • Chunks have adjustable overlap • Architecture: • Share nothing cluster (10’s-1000’s of nodes) • Queries refer to arrays as primary data type • Query planner optimizes for specific function
SciDBFeature Highlight – Multi-dimensional Arrays Promoter Signature Profiling What pathways are being perturbed by a modulator? LMF What compounds have similar transcriptional profiles? HIP-HOP What is the target of the modulator in yeast? Chemical Proteomics What proteins bind to my compounds? • Natural extensions: • Subsetting by different dimensions • Correlation by each dimension – where do they intersect • Multi-dimensional statistics? | XLDB 2011 | Gregory McAllister | October 19, 2011 | XLDB | Business Use Only
SciDBFeature Highlight – Uncertainty | XLDB 2011 | Gregory McAllister | October 19, 2011 | XLDB | Business Use Only Experimental measurements have an inherent error which is often discarded upon propagation through various analytics SciDBaims to incorporate a simple model of uncertainty – normal distributions for elements (i.e. standard deviations)
SciDBFeature Highlight – Data Persistence / Provenance | XLDB 2011 | Gregory McAllister | October 19, 2011 | XLDB | Business Use Only Arrays are immutable unless specifically defined otherwise CREATE UPDATABLE ARRAY U1 <a: double > [x=0:5,3,0, y=0:5,3,0] INPUT (U1,’/tmp/load.txt’); Even when declared as updatable, original cell values are never overwritten…a new version is created. SCAN(U1@DATETIME('02/20/2002')) Log files guarantee repeatability of data derivation ELN for computational biologists!
SciDBExample Use Case – Transcriptional Profiling Metric Probes Samples • Microarray – platform for simultaneously measuring the expression levels of thousands of genes • 60,000+ arrays • 60,000 probes (multiple probes per gene) • >100 indications • 6B+ data points • Use cases: • Target finding • Patient stratification • Biomarker identification | XLDB 2011 | Gregory McAllister | October 19, 2011 | XLDB | Business Use Only
SciDBExample Use Case – Transcriptional Profiling • Quickly being replaced by Next-Generation Sequencing • Digital readout • Highly reproducible, highly sensitive • Detects ~25% more genes than microarray • ~2000x more data points compared to microarray • GB per lane, TB per experiment, PB at scale-up Metric Genes Samples • Microarray – platform for simultaneously measuring the expression levels of thousands of genes • 60,000 arrays • 60,000 probes (multiple probes per gene) • >100 indications • 6B+ data points • Use cases: • Target finding • Patient stratification • Biomarker identification | XLDB 2011 | Gregory McAllister | October 19, 2011 | XLDB | Business Use Only
SciDBExample Use Case – Transcriptional Profiling • Quickly being replaced by Next-Generation Sequencing Microarray NGS Metric Store and mine the names of all people ever born in the history of the world, 90x Store and mine the names of all people in Eurasia Genes Samples • Microarray – platform for simultaneously measuring the expression levels of thousands of genes • 60,000 arrays • 60,000 probes (multiple probes per gene) • >100 indications • 6B+ data points • Use cases: • Target finding • Patient stratification • Biomarker identification | XLDB 2011 | Gregory McAllister | October 19, 2011 | XLDB | Business Use Only
SciDBExample Use Case – Transcriptional Profiling | XLDB 2011 | Gregory McAllister | October 19, 2011 | XLDB | Business Use Only • Array query language (AQL) • Similar in syntax to SQL CREATE ARRAY B <y: double, err2: double> [i=0:99,10,0, j=0:99,10,0] SELECT * FROM A, B SELECT count(part) FROM B GROUP BY i AS part • Array Functional Language (AFL) • Extensibility through UDF (PostgreSQL); operate on array
SciDBExample Use Case – Transcriptional Profiling | XLDB 2011 | Gregory McAllister | October 19, 2011 | XLDB | Business Use Only • Create the array • create array md_bounded <response:double NOT NULL,empty_indicator:indicator NOT NULL> [algo(string)=24,1,0, sample(string)=49820,1000,0, probe(string)=65000,1000,0] • Count the number of elements in one “slice” of an array • count ( slice ( md_bounded, algo, 'MAS5_150')); • Query execution time: 9.39 s • Find the min/max of array across one dimension • aggregate ( md_bounded, min(response), max(response), algo ) • Query execution time: 41 minutes, 29 s • For the MAS5_150 algorithm, what is the average response for each sample? • aggregate (slice ( md_bounded, algo, 'MAS5_150'), avg(response), sample) • Query execution time: 1 minute, 3 s • For the MAS5_150 algorithm, what is the average response for each probe? • aggregate (slice ( md_bounded, algo, 'MAS5_150'), avg(response), probe) • Query execution time: 1 minute, 15 s
SciDBExample Use Case – Transcriptional Profiling store ( pearson ( slice ( md_bounded, algo, 'MAS5_150'), slice ( md_bounded, algo, 'MAS5_150') ), md_bounded_MAS5150_pearson) • What questions do we want to ask? • What genes have similar expression profiles? • What diseases “look like” each other? • There is an abundance of literature answering these questions on the small scale…we want to be able to answer it across the entire data set. • Simple first test for SciDB • Pearson correlation as a database query: • Data matrix: 60,000+ samples x 60,000+ probes • Infrastructure: • 4 nodes, 16 cores, 2.4GHz, 1TB drives • 270 minutes, 19 s (* Oct 2011) | XLDB 2011 | Gregory McAllister | October 19, 2011 | XLDB | Business Use Only
SciDBExample Use Case – Transcriptional Profiling Li G et al. Nucl. Acids Res. 2009;37:e101-e101 | XLDB 2011 | Gregory McAllister | October 19, 2011 | XLDB | Business Use Only • Biclustering • Are there combinations of genes/samples that correlate strongly with each other? Are certain pathways over-represented? • Singular value decomposition • Kopp-Schneider A et al, Bioinformatics 2011 vol. 27 (15) pp. 2089-2097 • Hybrid R/SciDB algorithm implemented • 2160 x 60,000 matrix • Amazon EC2 • 4 nodes (2 XEON cores, 2.66 Ghz) • 8 GB memory • 3 iterations -> ~31 hours • * SciDB Oct 2011 build
SciDBWhere does it fit at NIBR? | XLDB 2011 | Gregory McAllister | October 19, 2011 | XLDB | Business Use Only Significant momentum in the field of “big data” analytics Blend new technologies with legacy systems “Right tool for the job”
| XLDB 2011 | Gregory McAllister | October 19, 2011 | XLDB | Business Use Only