Download
1 / 11
190 likes | 416 Vues
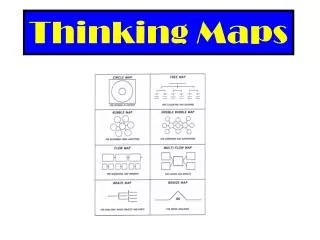
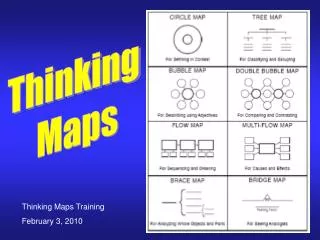
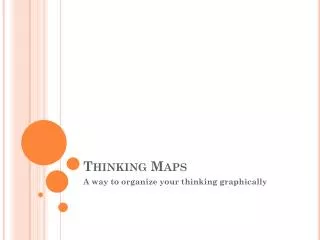
Welcome to: Thinking Maps in the Classroom. Instructor: Esmeralda Chavez. Thinking Maps at a glance. Circle Map . Thinking Process: Defining in Context

E N D
Welcome to:Thinking Maps in the Classroom Instructor: Esmeralda Chavez
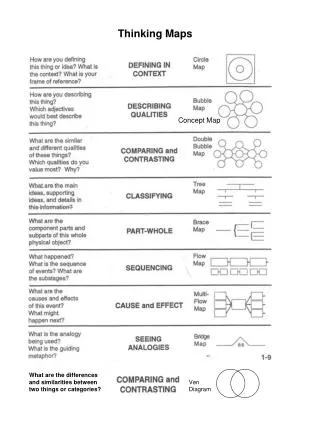
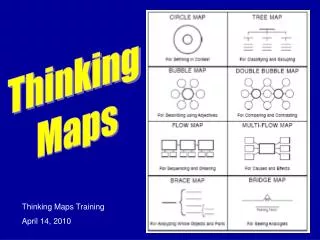
Circle Map Thinking Process: Defining in Context Design: The topic is in the middle of the smaller circle. Everything you know about the topic is in the larger circle. A box, that may be included, around the entire map is a “Frame of Reference” that is used to answer the question “How did I learn this?” Key questions for students: How are you defining this thing or idea? What is the context? Possible Usage: Brainstorming for writing, used as a starting point during the prewriting stage.
Bubble Map Adj. • Thinking Process: Describing Qualities • Design: The topic being described is in the center bubble. The outer bubbles contain adjectives and adjective phrases describing the topic. • Key questions for students: • How are you describing this thing? • What adjectives would best describe it? • Possible Usage: Describing things, identifying qualities, character traits, attributes and/or properties of things. The Bubble Map is a tool for enriching students’ abilities to identify qualities and use descriptive words. Topic
Flow Map Thinking Process: Sequencing Design: Each stage of the event is in the larger rectangles. The sub-stages are in smaller rectangles below the larger ones. NOTE: Not all Flow maps will have sub-stages. Key questions for students: What happened? What is the sequence of events? What are the sub-stages? Possible Usage: Can be used to plot a story, show historical events in sequence, steps in problem solving in math, identifying stages of a life cycle, and much more. EVENT sub stages
Brace Map Thinking Process: Part to whole relationship Design: On the line to the left, the name of the whole object is written. On the lines within the first brace, list the major parts. The subparts are listed in the next set of braces. Key questions for students: What are the parts and subparts of this whole physical object? Possible Usage: Used to analyze physical objects. Can be used with anatomy, boundaries in Geography, parts of tangible objects. It is for parts only, for “types” of things, a Tree Map should be used. Name of Object / Topic MajorSub parts Parts
Tree Map Thinking Process: Classifying Design: The category name is on the top line, subcategories on the second level, details under each subcategory. Key questions for students: What are the main ideas, supporting ideas, and details in information? Possible Usage: Used to sort things into categories or groups. It can also be used to find main and supporting ideas in stories. Main Idea or Category Sub SubSub Category CategoryCategory
Double Bubble Map Thinking Process: Comparing and Contrasting Design: In the center circles are the words for the two things being compared and contrasted. In the middle bubbles, use terms to show similarities. In the outside bubbles, describe the differences. If there are too many similarities or differences, students should prioritize and keep only the most important. Key questions for students: What are the similar and different qualities of these things? Possible Usage: A tool for comparing and contrasting two things. Similarities DifferenceDifference
Multi-Flow Map Event Thinking Process: Cause and Effect Design: The event is in the center rectangle. On the left side, causes of the event. On the right side, effects of the event. Key questions for students: What are the causes and effects of this event? What might happen next? Possible Usage: Used to show and analyze cause and effect relationships. It can also be used with only part of the map showing, such as for predicting outcomes. Cause(s) Effect(s) EeE
Bridge MAP Thinking Process: Sequencing Design: On the far left line, write the relating factor. On the top and bottom of the bridge, write in the first pair of things that have this relationship. On the right side of the bridge, write the second pair with the same relationship. The line of the bridge represents the relating factor between the pair of things. Key questions for students: What is the analogy being used? Possible Usage: Identifies similarities between relationships. The relating factor answers “How are they related?” The Bridge Map should be able to be read as a complete sentence. AS or Relating Factor Relating Factor
Post to Blog Now that you’ve learned about the 8 different thinking maps, look at page 4 of your syllabus for instructions on how to set up your blog at Wordpress.com For your first post, you will write a brief reaction to this power point. You will also need to use each thinking map and upload it to your blog. Focus on any topic you want, just make sure you provide a brief description of it with your thinking map.