Download
1 / 16
160 likes | 289 Vues
Development tendencies of foreign trade before the Czech republic accession into the European Union.

E N D
Development tendencies of foreign trade before the Czech republic accession into the European Union
Purpose of the lecture :(i)analyse development trends of Czech foreign trade with comparison of the EU 15 countries(ii)develop growth models of foreign trade of these countries for deriving of prognosis
Basic assumptions(i) Efficient integration of the Czech Republic into the EU requires to increase significantly competitiveness of the Czech economy(ii)Competitiveness is measured by many indicators but the most important is a “TT”(iii)For agriculture is, of course, significant agricultural foreign trade(iv)For objective conclusions isn’t enough to make static analysis but tools for dynamic analysis must be applied.
The Czech Republic in the last months approximated significantly to the European union (in spite of certain ambiguity of this year’s Irish referendum) and year 2004 or years immediately following can be connected with real expectations of the accession into “the European fifteen”. However, our republic, of course, will not be the only new member. Nevertheless, among candidate states the CR has fixed its position and classifies roughly at a level of Slovenia, Hungary and Malta.
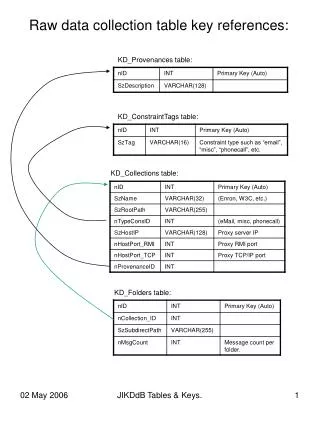
October 2001 OECD estimations referring to growth of the world and the Czech economics are more pessimistic. In case of the CR they count on growth of GDP in 2001 by 2,7 % and in 2002 by 2,8 %, for OECD countries (30 states) by 1,0 % (2001) and 1,2 % (2002) and for the whole world 1,3 % (2001 and 2002). A lower efficiency of the world economics necessarily affects the Czech Republic because our state together with Hungary has among post-communistic European countries the most open economics. However, compared to a situation in September, in October prices of oil fell considerably which after all could support powers inhibiting a recession. Table 1: Development of CR GDP (in % in constant prices of 1995)Source: ČSÚ
to date 1.1. 1993 31.12. 1993 31.12. 1994 31.12. 1995 31.12. 1996 31.12. 1997 31.12. 1998 31.12. 1999 30.9 2000 31.3. 2001 mld. CZK 224,3 287,7 342,5 457,3 578,9 748,7 727,0 822,6 797,2 829,9 Table 2: Foreign indebtedness of the CR Source: ČNB Note: Pasive in relation to abroad without property investment A basic economic failure was a sale of businesses to Czech managers on credit. Outflow of finance from businesses meant that no means for restructuralisation are left, nor for development and in many times nor for an own operation. In many enterprises the indebtedness is so high that they nearly did not survive the era of its first private owners.
state millions CZK state millions CZK Netherland 232 621,9 Great Britain 36 965,6 Germany 206 912,1 Belgium 35 763,7 Austria 100 150,3 France 34 493,2 USA 48 203,6 Japan 4 737,2 1995 1996 1997 1998 1999 2000 Turnover 1 245 167 1 346 973 1 584 271 1 779 247 1 881 925 2 367 637 Export 574 722 594 629 722 501 850 308 908 756 1 120 427 Import 670 445 752 344 861 770 928 939 973 169 1 247 210 Balance - 95 723 - 157 715 - 139 269 - 78 631 - 64 413 - 126 783 Table 3: Direct foreign investments into the CR in 1990 – 2000 in millions CZK from countries Source: MPO Table 4: Development of the whole foreign CR trade (mil. CZK) Source: ČSÚ
Y= a+ bx Y=a*xb State a b R t-test a b R2 t-test A 0,79 +0,0091 0,77 P 0,79 +0,039 0,35 P B/LUX 0,937 +0,0145 0,80 P 0,92 +0,066 0,61 P DM 1,125 -0,00002 0,001 N 1,097 +0,014 0,04 N FIN 0,973 +0,04 0,90 P 0,916 +0,174 0,91 P F 0,915 +0,013 0,86 P 0,892 +0,0678 0,83 P D 1,132 +0,0009 0,06 N 1,157 -0,011 0,025 N GR 0,423 -0,00054 0,09 N 0,432 -0,018 0,07 N IRL 1,1 +0,041 0,97 P 1,088 +0,134 0,8 P I 0,99 +0,02 0,33 N 0,903 +0,12 0,27 N NL 1,0 +0,0074 0,52 N 0,99 +0,034 0,26 N PORT 0,65 +0,0004 0,05 N 0,65 +0,0025 0,002 N E 0,61 +0,022 0,82 P 0,586 +0,15 0,76 P SW 1,03 +0,023 0,95 P 1,012 +0,0937 0,92 P UK 0,83 +0,0027 0,25 N 0,805 +0,031 0,24 N EU-15 0,94 +0,01 0,74 P 0,93 +0,049 0,55 P CZ 1,003 -0,012 0,50 N 1,02 -0,06 0,25 N Comparison of foreign trade of state of EU – 15 with the CR in period 1989 – 2000 Table 5: Trends of balance of foreign trade of goods and services in total
Key: Y = balance of foreign trade measured by an indicator export/import x = a time vector a = a function constant b = a function parameter R (R2) = a rate of dependence tightness P (N) means that parameters of a function are (are not) evidential In the table for the member states of the EU-15 following abbreviations are used: A - Austria B/LUX - Belgium+Luxemburg DM - Denmark FIN - Finland F - France D - Germany GR - Greece IRL - Ireland I - Italy NL - the Netherlands PORT - Portugal E - Spain SW - Sweden UK - England CZ - the Czech Republic
Conclusions of trade development of the EU-15 comparing to the CR A linear trend function describes a course of balance development of the foreign trade in more details and enables a more detailed dispersion of states into following groups: a) an evidential net exporter with an evidential growing trend – IRL, SW, NL b) an evidential net exporter with an unconvincing growing trend – D c) an evidential net exporter with an unconvincing decreasing trend – DM Other economics which showed an average balance of the foreign trade in the whole period positive including the total EU-15 have in the trend function a constant < 1 but except Italy they have evidential high pace of growth so that the average balance can be positive. An opposite development is typical for the CR. It belongs by a size of the constant to export states but with a quickly decreasing trend which in average in the evaluated period creates a sum of foreign trade balance as a negative number.
Growth models of agrarian foreign trade in period 1989 – 1998Table 6: Trends of balance of agrarian foreign trade in totalKey: Y = balance of foreign trade measured by an indicator export/import x = a time vector a = a function constant b = a function parameter R (R2) = a rate of dependence tightness P (N) means that parameters of a function are (are not) evidential
Mutual connection between development of a volume of goods and services in total and agrarian foreign trade was described by a relation agrarian FT = function (FT of goods and services in total) A power function is for an evaluation of growth dynamics more suitable, its tightness of dependence is very similar. By it it is possible to divide countries into 4 groups: Import · of economies where agrarian import grows faster or almost in the same pace as the import in totalAustria (elasticity of the function 1,17) , Spain (1,052), Finland (1,01), Belgium and Luxemburg (0,99), Denmark (0,97), Portugal (0,92) and Greece (0,89). The CR should pay attention to these states after a research of commodity structure of their agrarian import though that B/LUX, DM, and E are net exporters. · countries with a middle pace of addition of agrarian import in comparison with the total importFrance (elasticity of the function 0,76), Sweden (0,66), EU – 15 (0,64), England (0,61), German (0,54), Ireland (0,5). In this group F and IRL are net exporters, other economies have their balances of agrarian trade highly passive, except the EU-15 which has a ratio export/import in agricultural commodity at a level 0,94. the CR belong to this group. Its addition of agrarian import reacts to 1 % addition of the total import with a pace 0,65 %. · other two states, the Netherlands (function elasticity 0,35) and Ireland (0,18) have in this function both parameters highly unconvincing and they can not be said that import of other goods and services in them grows 3x resp. 5x faster than the import of agrarian commodity
Export · countries exporting relatively more, resp. by little less agrarian commodities than labour and services in total are Austria (elasticity of the function 1,17), France (1,15), Belgium and Luxemburg (1,06), Portugal (1,01), Sweden (1,0), Spain (0,98), Italy (0,92) and Greece (0,8). · economies where the addition of export of agrarian goods per 1 % volume of export of goods and services in total is middle are Germany (0,69), EU-15 (0,67), Denmark (0,64), Finland and England (0,59). In this group also the CR belongs, with function elasticity 0,76, it means higher than in import function. So it can be said that in development it has founded tendency to decrease passive balance of agrarian foreign trade though not very convincingly. · The Netherlands and Ireland (elasticity of the function 0,24) signalise unconvincingly a low addition of agrarian export per 1 % change of the total export. It can be summed that most of the EU-15 states and the group as a whole pay attention and such a support to the agrarian foreign trade so that it develop in the same way as other branches. In the CR these close connections can not be proved.


![New words [nju:] [wə:dz] 新单词](https://cdn2.slideserve.com/4326544/slide1-dt.jpg)