Download
1 / 17
170 likes | 344 Vues
Quantitative Use of Ocean Color Data in NCEP Operational Modeling. Eric Bayler NOAA/NESDIS/STAR Dave Behringer NOAA/NWS/EMC Avichal Mehra NOAA/NWS/EMC Sudhir Nadiga NOAA/NWS/EMC (IMSG). JCSDA Science Workshop: 10-12 Oct 2012. Outline. Eric Bayler (PI) Project Description

E N D
Quantitative Use ofOcean Color Datain NCEP Operational Modeling Eric Bayler NOAA/NESDIS/STAR Dave Behringer NOAA/NWS/EMC Avichal Mehra NOAA/NWS/EMC Sudhir Nadiga NOAA/NWS/EMC (IMSG) JCSDA Science Workshop: 10-12 Oct 2012
Outline • Eric Bayler (PI) • Project Description • Year-1 Tasks and Achievements • Satellite data • HYCOM – Real-Time Ocean Forecast System (RTOFS) • MOM4 – Global Ocean Data Assimilation System / Coupled Forecast System (GODAS/CFS) • SudhirNadiga • Results: MOM4 (GODAS) • Summary
Objective Improve the representation of solar radiation penetration in the water column, and the resulting heating vertical profile for NWS/NCEP operational modeling: • Seasonal-interannual Global Ocean Data Assimilation System (GODAS) / Coupled Forecast System (CFS) • Real-Time Ocean Forecast System (RTOFS) Scientific Basis: • Solar shortwave heating of the upper layers of the ocean is dependent on the wavelength of radiation and optical properties of water column • Correlation to the optical properties of water column • Chlorophyll • Diffuse attenuation at 490 nm (K490) • Diffuse attenuation of photosynthetically active radiation (KPAR) • Satellite (SeaWiFS, VIIRS) ocean color data can be used Funding: • Year-1: JSDI $100,000 • NWS/EMC contract support • Year-2: JSDI $40,000 • NWS/EMC contract support • 29% funding of Year-2 request requires suspension of the HYCOM (RTOFS, near-real-time) component of our ocean color efforts
Value BENEFITS: • Improve modeling of near-surface stability, stratification, and resulting affects on the mixed-layer’s characteristics and air-sea fluxes. • Provides a more realistic representation of shortwave radiation penetration in the upper ocean, particularly for dynamically important areas, such as the Pacific warm pool and cold tongue • Expected impact on the estimation of the mass fields and circulation in the upper ocean in the high-spatial-resolution short-term forecasts, as well as seasonal-interannual forecasts. Return on Investment: • Projected improved seasonal-interannual atmosphere-ocean predictions supporting, in particular, the agriculture and energy sectors • Projected improved near-real-time predictions supporting improved boundary conditions for physical, biogeochemical and ecosystem modeling and decision support
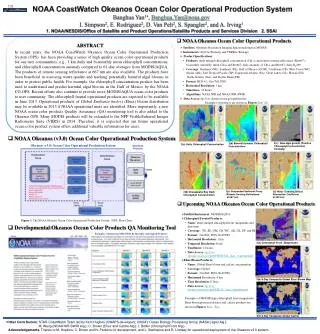
Year-1: Tasks & Achievements • Satellite Data • Current operational climatology represents only 1997-2001 data • Prepared SeaWiFS ocean color data sets for the complete data record (1997-2010) for • Chlorophyll-a • Diffuse attenuation at 490 nm (K490) • Diffuse attenuation for photosynthetically active radiation (KPAR) • Produced annual mean cycle climatology • Produced sequential monthly means for duration of data record (~ 13 years) SeaWiFS chlorophyll climatology (mg m-3) limited period (1997-2001): a) Boreal winter; b) Austral winter Chlorophyll difference (mg m-3) for SeaWiFS extended climatology (1997-2010) minus limited climatology (1997-2001): c) Boreal winter; d) Austral winter (a) (b) (c) (d)
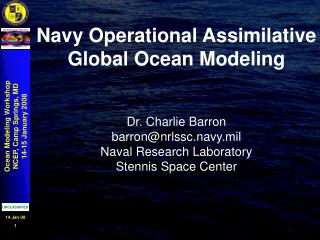
Year-1: Tasks & Achievements • MOM4 (GODAS) • Completed control case using current GODAS limited-periodSeaWiFS chlorophyll annual cycle climatology • Completed Experiment-1using SeaWiFS chlorophyll annual cycle extended climatology • Completed Experiment-2using sequential SeaWiFS monthly mean chlorophyll Year-1 Year-13 GODAS difference plots for Experiment 1 (extended climatology) minus Control case for sea-surface height (SSH) and mixed-layer depth (MLD).
Year-1: Tasks & Achievements • RTOFS • Completed control case using current RTOFS limited-periodSeaWiFS K490annual cycle climatology • Completed Experiment-1using SeaWiFS K490annual cycle extended climatology • Completed Experiment-2using sequential SeaWiFS monthly mean K490 RTOFS difference plots for Experiment 1 (extended climatology) minus Control case for: Sea-surface height (SSH) a) January b) July Mixed-layer depth (MLD) c) January d) July. (a) (b) (c) (d)
Model Forcing • Original Design • HYCOM (RTOFS): • ECMWF Re-analysis 40 (ERA-40): 1957-2002 • Legacy forcing • Uncoupled • MOM4 (GODAS/CFS): • NCEP-DOE Reanalysis 2 (RA-2): 1979-2012 • Legacy forcing • Uncoupled • Current Analysis Effort • MOM4 and HYCOM • NCEP Climate Forecast System Reanalysis (CFSR): 1979-2009 • Coupled • Better captures air-sea feedback • Permits comparison for robust results
NWS/EMC Operational Ocean Models Behringer, D. W. “The Global Ocean Data Assimilation System at NCEP,” AMS 87th Annual Meeting, 2007. Mehra, A., and I. Rivin. “The Real Time Operational Forecast System for the North Atlantic Ocean,” Terra Atmos. Ocean, 2010.
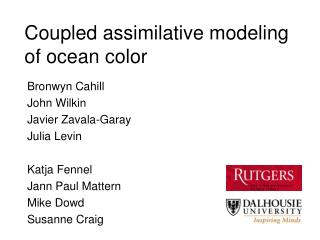
Experiment-2 minus Control Case: Temperature 2° S - 2° N, 120° W EXPERIMENT2 – CONTROL RUN Experiment-2 minus Control Case (5x difference) Control Case: Interannual variability Temperature Difference (°C) Green: Depth of 20° C isotherm (thermocline)
Experiment-2 minus Control Case: Zonal Velocity 2° S - 2° N, 120° W EXPERIMENT2 – CONTROL RUN Experiment-2 minus Control Case (5x difference) Control Case: Interannual variability Zonal Velocity Difference (cm s-1)
Experiment-2 minus Control Case: Salinity 2° S - 2° N, 120° W Experiment-2 minus Control Case (5x difference) Control Case: Interannual variability Salinity Difference (PSS-1978)
Experiment-2 minus Control Case: Mixed-Layer Depth 2° S - 2° N, 150 ° E - 120° W Satellite Chlorophyll Forcing Negative Chlorophyll Anomaly (mg m-3) Mixed-Layer Depth Anomaly (m) Mixed-Layer Depth Difference (m) (Exp2-Control: MLD x 4) (Control-MLD Mean) (Chl x -200) Shallow Mixed-layer Depth = Depth (T = SST-0.1°C)
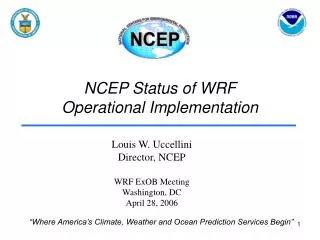
Experiment-2 minus Control Case: Upper-Ocean Heat Content 2° S - 2° N, 150 ° E - 120° W Satellite Chlorophyll Forcing Negative Chlorophyll Anomaly (mg m-3) Ocean Heat Content Anomaly (J m-2) Ocean Heat Content Difference (J m-2) (Chl x -200) (Exp2-Control: OHC x 10-7) (Control-OHC Mean x 10-8) Upper-Ocean Heat Content (0 – 300m)
Experiment-2 minus Control Case: Upper-Ocean Heat Content Ratio
Summary TASKS: • Completed extended SeaWiFS climatologies and monthly mean fields for for chlorophyll, K490, and KPAR • Completed GODAS and RTOFS control cases that employ the existing limited-period SeaWiFS climatology • Completed GODAS and RTOFS Experiment-1 runs that use the extended annual mean SeaWiFS climatology • Completed GODAS and RTOFS Experiment-2 runs that use SeaWiFS sequential monthly means for the duration of the data record • NWS/EMC submitted operational User Requests for satellite ocean color swath data • GODAS: chlorophyll • RTOFS: K490, and KPAR RESULTS: • MOM4 (GODAS/CFS) and HYCOM (RTOFS) are sensitive to changes in shortwave penetration • Chlorophyll concentration (MOM4) • K490 / KPAR (HYCOM) • Models demonstrate significant responsiveness to sequential (quasi-near-real-time) forcing in comparison to comparable annual mean cycle forcing. • Differences grow in time • Changes observed in mixed-layer • Largest parameter differences (density, mean circulation) at the depth of the thermocline in the Eastern Pacific Cold Tongue • Differences in upper-ocean heat content in the Eastern Pacific Cold Tongue are as large as 20% of the interannual variability FUTURE DIRECTION: • Near-real-time data assimilation of operational ocean color data • Unification of near-real-time and seasonal-interannual ocean color data ingest methodology to align with operational goals • Implications for integration with NOAA’s ecosystem forecasting objective • NEED RESOURCES TO COMPLETE NEAR-REAL-TIME ANALYSES AND DEVELOPMENT
Experiment-2 minus Control Case: Meridional Velocity 2° S - 2° N, 120° W Experiment-2 minus Control Case (1x difference) Control Case: Interannual variability Meridional Velocity Difference (cm s-1)