Download
1 / 24
240 likes | 336 Vues
Methodology for the 2D-DIGE Gel Scanning. After running 2D-DIGE, the scanner exploits the property of dye used for labeling the sample to produce a protein profile image. The dye when exposed to different wavelength, due to excitation and emission property of the dyes the images can be captured.

E N D
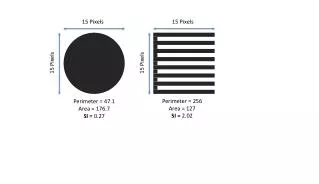
Methodology for the 2D-DIGE Gel Scanning After running 2D-DIGE, the scanner exploits the property of dye used for labeling the sample to produce a protein profile image. The dye when exposed to different wavelength, due to excitation and emission property of the dyes the images can be captured Related Los: Eexcitation and Emission property, Pixels > Prior Viewing- IDD-11. Protein quantification, IDD-13. Cyanine dye labeling, IDD-14. Isoelectric focusing, IDD-18. Second dimension separation of proteins > Future Viewing- IDD-24. DIGE gel analysis, IDD-26. Spot picking, IDD-31. MALDI-TOF data analysis • Course Name: DIGE Gel Scanning • Level(UG/PG):UG ?? • Author(s) : Dinesh Raghu, Vinayak Pachapur • Mentor: Dr. Sanjeeva Srivastava *The contents in this ppt are licensed under Creative Commons Attribution-NonCommercial-ShareAlike 2.5 India license
Learning objectives 1 After interacting with this learning object, the learner will be able to: Define Learn the steps involved in preparing the cassette Determine the parameter settings for the scanning Operate the steps involved to perform sample scan Interpret the steps involved to perform image processing Assess the troubleshooting steps involved in the experiments. 2 3 4 5
Master Layout 1 Turn the system ON (Slide:5) 2 Prepare the cassettes for scan (Slide: 6-8) 3 • Set up a scan (Slide: 9-12) Scan a sample (Slide: 13-14) 4 Report view (Slide: 15-18) 5
Definitions and Keywords 1 1. DIGE: Difference gel electrophoresis is advanced technique to carry out 1D and 2D separation of protein. In comparison to normal 2D, DIGE is a very robust technique for detection, quantification and analysis of differential expressed protein spots. 2.CyDye labels: CyDye DIGE dyes consist of three dyes (Cy2, Cy3, and Cy5), which differ in excitation and emission wavelength are matched for mass and charge. The labels offer great sensitivity and multiplexing property, which helps to run different protein samples within the same DIGE gel. 2 3 4 5
1 2 3 4 5 Step 1: T1: Turn the system ON Main switch Description of the action Audio Narration When the instrument is ON, it will go for automatic calibration to check for proper connections. Take user through the IDD of Sample labelling, Cydye chemistry, 2D DIGE run. Instruct user to ON the instrument, let user press the main switch. Animate power light to turn ON, scanning light to blink for 2 to 3 min. later the ready light must be ON. If any connection error display the error message and instruct user to restart the instrument.
1 2 3 4 5 Step 2: T2: Prepare the cassettes for scan Description of the action Audio Narration Take out the cassette for scanning, cassette provides the platform for gels to scan. Instruct user to prepare the cassettes for scan, let user takes out the cassettes from the rack covered in cloth. Now let user pick tissue, and make moments on the cassettes to clean it properly. User should click for cleaning
1 2 3 4 5 Step 2: T2: Prepare the cassettes for scan Description of the action Audio Narration A hollow cassette is used to scan large format gels in the glass plates. For small gels, cassette with glass platform is used. Instruct user to place the glass plates in the cassette after 2D run. Let user takes out the glass plates from the Dalt run unit, takes a tissue to clean the glass plates, animate user action on the glass plates. Once the glass plate is cleaned, let user place it on the cassette as shown. Now let user close the lid of cassette, by locking the knob as shown in the figure.
1 2 3 4 5 Step 2: T2: Prepare the cassettes for scan Description of the action Audio Narration The cassette need to be placed inside the scanner. Proper fit in the grove provided is necessary for better scanning. Instruct user to open the door of the scanner, let user pick the cassette loaded with the gel, let user place it inside the scanner, into the groves, to make a proper fit and later close the door. Animate the user actions.
1 2 3 4 5 Step 3: T3: Set up a scan Description of the action Audio Narration User need to set the parameters for scanning and specify the scanning area depending on the size of the gel used for the experiment. Instruct user to click on scanner icon on desktop, Ettan DIGE Imager dialog opens up.
1 2 3 4 5 Step 3: T3: Set up a scan Audio Narration Description of the action For gel format: predefined gel format or user can define the gel format in user select. For Dige image the pixel need to be set for 100. chemistry deals with dye labeling of samples, matric type need to be gel. If user is scanning a DIGE gel, user need to select DIGE file naming format. Instruct user to select the options like for gel format: predefined, user select. Pixel size (um): 100. Chemistry: DIGE labelling, Minimal Labelling, silver stained, comassie blue. Matix type: gel. Animate the choices for the user in the window after user clicks on the parameters.
1 2 3 4 5 Step 3: T3: Set up a scan Audio Narration Description of the action Selection of the Channel check boxes must be performed in sequential numerical order. The excitation and emission wavelength helps to produce optimum results. Cy2: Ex/Em:480/520 for 0.35exposure. Cy3: Ex/Em:540/595 for 0.90 exposure. Cy5: Ex/Em:635/680 for 0.70 exposure. User can set the exposure time depending upon sample quantity used. Let user select the number of channels for scan by clicking the Channel check box. Animate four channels. When user selects channel and the dye, the excitation and emission filter used for the dye must automatically get displayed. For DIGE sample user need to select 3 channels and Cy3, cy2 and cy5 dye.
1 2 3 4 5 Step 3: T3: Set up a scan Audio Narration Description of the action Once all the setting are done, user can go for scanning. Before scanning the software asks to save the image. Provide the location under the folder and name the gel properly. Let user selects the grid area for scanning the gel. Animate user control for making the selection. Once user done with area selection, instruct user to click on SCAN button. A window dialog to save image must pop-up. Let user create a folder and name the gel and saves int in the folder.
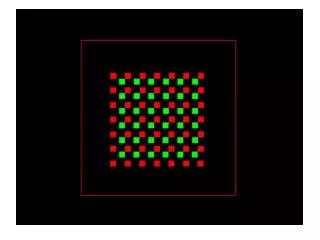
1 2 3 4 5 Step 4: T4: Scan a sample Audio Narration Description of the action Please re-draw the figure.
1 2 3 4 5 Step 4: T4: Scan a sample Audio Narration Description of the action During scanning the image get displayed row by row for each channel. In case if image shows some red spots in the protein region, stop the scan and re-scan with less exposure time. Display the scanning window as shown in previous slide, with all the user defined data before scanning to be displayed on the window. Animate the scan progress percent with time left, and gel image coming up row by row. Let user have option to click on each channel to view the image.
1 2 3 4 5 Step 5: T5: View report Audio Narration Description of the action The display gives the scanning report. Once the scanning is over, following window must be displayed. User can click on View report button to check the gel.
1 2 3 4 5 Step 5: T5: View report Audio Narration Description of the action Cropping and image editing depends on user requirements and just for appearance purpose user can make the changes. cropping helps to remove unwanted area from analysis. In report Viewer. Instruct user to crop the gel, let user click on edit: crop. Let user have the control to define the area for cropping. Once user finishes cropping, display only the cropped image. Instruct user to adjust the image intensity, let user click on edit: image scaling, move control points to visualize the gel properly.
1 2 3 4 5 Step 5: T5: View report Audio Narration Description of the action Software provides option for user to rotate the image and later asks for save option. In report Viewer. Instruct user to crop the gel, let user click on edit: Rotate. Let user have the optional for vertical, horizontal rotation option.
1 2 3 4 5 Step 5: T5: View report Audio Narration Description of the action Now the gel image is ready to get uploaded and analysed by decyder or IMP software tools. For next step go through IDD of DIGE DeCyder analysis and IDD of IMP. Now user can save the image and overwrite on the previously saved location.
Button 01 Button 02 Button 03 Slide 6-8 Slide 13-14 Slide 15-18 Slide 9-12 Slide 5 Tab 01 Tab 02 Tab 03 Tab 04 Tab 05 Tab 06 Tab 07 Name of the section/stage Animation area • INTERACTION-1: • In Slide-6: If user ON the main switch and within no time clicks on the scanning icon on the desktop. • Instruction: Display a error message like in slide-6, and remind user the main switch is a one time press ON and OFF switch. Interactivity area Instructions/ Working area Credits
Questionnaire: APPENDIX 1 Question 1 What is the excitation emission wavelength of cy3? a)480/520 b)540/595 c)635/680 d)595/540 Answer: b)540/595 Question 2 What is the pixel used for DIGE gel? a)100um b)100mm c)150um d)200um Answer:a)100um
Questionnaire: APPENDIX 1 Question 3 How many samples can be run in single DIGE gel? a) 3 • 2 • 1 • 4 Answer: 3 Question 4 How many Cydye labels are there? a)3 b)2 c)4 d)1 Answer: a)3
Questionnaire: APPENDIX 1 After scanning of DIGE gel in DIGE scanner, user get how many image? • 3 • 2 • 4 • 5 Answer: a)3
APPENDIX 2 Links for further reading Paper: 1. GE Healthcare Ettan DIGE Imager User Manual 11-0036-59 Edition AC
APPENDIX 3 Summary The Typhoon DIGE scanner helps to produce a three different image from a single gel through the implication different excitation and emission filters. The labels offer great sensitivity and multiplexing property, exploited by the scanner to produce three different images which helps to run different protein samples within the same DIGE gel.