Download
1 / 1
10 likes | 99 Vues
XMM-Newton slew survey hard band sources. ESAC. R.D. Saxton a , A.M. Read b , R.S. Warwick b , M.P. Esquej b a European Space Agency (ESA), European Space Astronomy Centre (ESAC), Apartado 78, 28691 Madrid, Spain

E N D
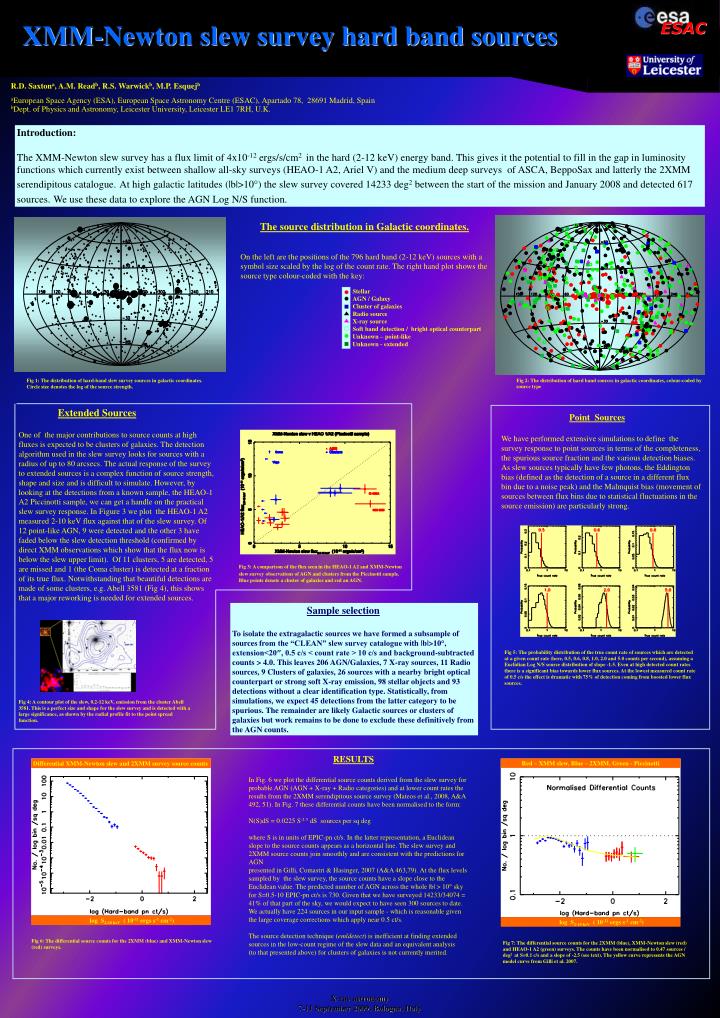
XMM-Newton slew survey hard band sources ESAC R.D. Saxtona, A.M. Readb, R.S. Warwickb,M.P. Esquejb aEuropean Space Agency (ESA), European Space Astronomy Centre (ESAC), Apartado 78, 28691 Madrid, Spain bDept. of Physics and Astronomy, Leicester University, Leicester LE1 7RH, U.K. Introduction: The XMM-Newton slew survey has a flux limit of 4x10-12 ergs/s/cm2 in the hard (2-12 keV) energy band. This gives it the potential to fill in the gap in luminosity functions which currently exist between shallow all-sky surveys (HEAO-1 A2, Ariel V) and the medium deep surveys of ASCA, BeppoSax and latterly the 2XMM serendipitous catalogue.At high galactic latitudes (|b|>10°) the slew survey covered 14233 deg2 between the start of the mission and January 2008 and detected 617 sources.We use these data to explore the AGN Log N/S function. The source distribution in Galactic coordinates. On the left are the positions of the 796 hard band (2-12 keV) sources with a symbol size scaled by the log of the count rate. The right hand plot shows the source type colour-coded with the key: Stellar AGN / Galaxy Cluster of galaxies Radio source X-ray source Soft band detection / bright optical counterpart Unknown – point-like Unknown - extended Fig 2: The distribution of hard band sources in galactic coordinates, colour-coded by source type Fig 1: The distribution of hard-band slew survey sources in galactic coordinates. Circle size denotes the log of the source strength. Extended Sources One of the major contributions to source counts at high fluxes is expected to be clusters of galaxies. The detection algorithm used in the slew survey looks for sources with a radius of up to 80 arcsecs. The actual response of the survey to extended sources is a complex function of source strength, shape and size and is difficult to simulate. However, by looking at the detections from a known sample, the HEAO-1 A2 Piccinotti sample, we can get a handle on the practical slew survey response. In Figure 3 we plot the HEAO-1 A2 measured 2-10 keV flux against that of the slew survey. Of 12 point-like AGN, 9 were detected and the other 3 have faded below the slew detection threshold (confirmed by direct XMM observations which show that the flux now is below the slew upper limit). Of 11 clusters, 5 are detected, 5 are missed and 1 (the Coma cluster) is detected at a fraction of its true flux. Notwithstanding that beautiful detections are made of some clusters, e.g. Abell 3581 (Fig 4), this shows that a major reworking is needed for extended sources. Point Sources We have performed extensive simulations to define the survey response to point sources in terms of the completeness, the spurious source fraction and the various detection biases. As slew sources typically have few photons, the Eddington bias (defined as the detection of a source in a different flux bin due to a noise peak) and the Malmquist bias (movement of sources between flux bins due to statistical fluctuations in the source emission) are particularly strong. Fig 3: A comparison of the flux seen in the HEAO-1 A2 and XMM-Newton slew surveyobservations of AGN and clusters from the Piccinotti sample. Blue points denote a cluster of galaxies and red an AGN. • Sample selection • To isolate the extragalactic sources we have formed a subsample of sourcesfrom the “CLEAN” slew survey cataloguewith |b|>10°, extension<20″, 0.5 c/s < count rate > 10 c/s and background-subtracted counts > 4.0. This leaves 206 AGN/Galaxies, 7 X-ray sources, 11 Radio sources, 9 Clusters of galaxies, 26 sources with a nearby bright optical counterpart or strong soft X-ray emission, 98 stellar objects and 93 detections without a clear identification type. Statistically, from simulations, we expect 45 detections from the latter category to be spurious. The remainder are likely Galactic sources or clusters of galaxies but work remains to be done to exclude these definitively from the AGN counts. Fig 5: The probability distribution of the true count rate of sources which are detected at a given count rate (here, 0.5, 0.6, 0.8, 1.0, 2.0 and 5.0 counts per second), assuming a Euclidian Log N/S source distribution of slope -1.5. Even at high detected count rates there is a significant bias towards lower flux sources. At the lowest measured count rate of 0.5 c/s the effect is dramatic with 75% of detection coming from boosted lower flux sources. Fig 4: A contour plot of the slew, 0.2-12 keV, emission from the cluster Abell 3581. This is a perfect size and shape for the slew survey and is detected with a large significance, as shown by the radial profile fit to the point spread function. RESULTS In Fig. 6 we plot the differential source counts derived from the slew survey for probable AGN (AGN + X-ray + Radio categories) and at lower count rates the results from the 2XMM serendipitous source survey (Mateos et al., 2008, A&A 492, 51). In Fig. 7 these differential counts have been normalised to the form: N(S)dS = 0.0225 S-2.5 dS sources per sq deg where S is in units of EPIC-pn ct/s. In the latter representation, a Euclidean slope to the source counts appears as a horizontal line. The slew survey and 2XMM source counts join smoothly and are consistent with the predictions for AGN presented in Gilli, Comastri & Hasinger, 2007 (A&A 463,79). At the flux levels sampled by the slew survey, the source counts have a slope close to the Euclidean value. The predicted number of AGN across the whole |b| > 10° sky for S=0.5-10 EPIC-pn ct/s is 730. Given that we have surveyed 14233/34074 = 41% of that part of the sky, we would expect to have seen 300 sources to date. We actually have 224 sources in our input sample - which is reasonable given the large coverage corrections which apply near 0.5 ct/s. The source detection technique (emldetect) is inefficient at finding extended sources in the low-count regime of the slew data and an equivalent analysis (to that presented above) for clusters of galaxies is not currently merited. Red – XMM slew, Blue – 2XMM, Green - Piccinotti Differential XMM-Newton slew and 2XMM survey source counts log S2-10 keV ( 10-11 ergs s-1 cm-2) log S2-10 keV ( 10-11 ergs s-1 cm-2) Fig 6: The differential source counts for the 2XMM (blue) and XMM-Newton slew (red) surveys. Fig 7: The differential source counts for the 2XMM (blue), XMM-Newton slew (red) and HEAO-1 A2 (green) surveys. The counts have been normalised to 0.47 sources / deg2 at S=0.1 c/s and a slope of -2.5 (see text). The yellow curve represents the AGN model curve from Gilli et al. 2007. X-ray astronomy 7-11 September 2009, Bologna, Italy